
Seth Rao
CEO at FirstEigen
10 Enterprise Data Observability Tools Worth Evaluating
In today’s data-driven world, ensuring the health and reliability of data systems is paramount for any organization. Data observability tools play a crucial role in achieving this by providing comprehensive monitoring and analysis of data flows and system performance. These tools help identify and resolve data issues in real-time, ensuring that your data is accurate, consistent, and reliable.
Data observability encompasses various aspects such as data quality, data lineage, and system health. By implementing these tools, organizations can gain deeper insights into their data operations, enabling them to make informed decisions and maintain high data standards.
In this guide, we will explore the top data observability tools trusted by leading tech companies in 2026. We will delve into their key features, the challenges they address, and how to choose the best tool for your business needs. Whether you are a data engineer, IT professional, or business analyst, understanding and utilizing these tools can significantly enhance your data strategy and operational efficiency.
What are Data Observability Tools?
Data observability tools are specialized software solutions designed to monitor, analyze, and ensure the health and performance of data systems. These tools provide insights into data quality, track data lineage, and detect anomalies within data flows.
By continuously collecting and analyzing data metrics, observability tools help organizations maintain the integrity, reliability, and availability of their data across various platforms and environments. They play a crucial role in identifying data issues in real-time, enabling timely interventions to prevent data-related problems.
Why Are Data Observability Tools Needed?
Data observability tools are essential for several reasons:
- Ensuring Data Quality: These tools help maintain high data quality by monitoring and detecting anomalies, inconsistencies, and errors in data systems.
- Improving Reliability: By continuously tracking data flows and system performance, observability tools ensure that data is reliable and available when needed.
- Enhancing Decision-Making: With accurate and reliable data, organizations can make informed decisions based on real-time insights.
- Reducing Downtime: Observability tools identify potential issues before they become critical, reducing system downtime and improving operational efficiency.
- Compliance and Auditing: They provide detailed data lineage and audit trails, which are essential for regulatory compliance and data governance.
Difference Between Data Observability and Data Monitoring
While data observability and data monitoring are related, they serve different purposes and provide distinct benefits:
- Scope:
- Data Monitoring: Focuses on tracking specific metrics and performance indicators within data systems. It provides alerts when predefined thresholds are breached.
- Data Observability: Offers a holistic view of data health, including data quality, lineage, and system behavior. It goes beyond simple monitoring by analyzing the entire data ecosystem.
- Proactive vs. Reactive:
- Data Monitoring: Often reactive, providing alerts and notifications after an issue occurs.
- Data Observability: Proactive, identifying potential issues before they become critical and offering insights for preventive measures.
- Insights:
- Data Monitoring: Delivers specific, point-in-time metrics and status updates.
- Data Observability: Provides comprehensive insights into data flows, dependencies, and system interactions, enabling deeper analysis and understanding.
- Use Cases:
- Data Monitoring: Suitable for tracking key performance indicators (KPIs) and ensuring systems are running within acceptable parameters.
- Data Observability: Ideal for complex data environments where understanding the interdependencies and behavior of data is crucial for maintaining overall data health.
By integrating data observability and data monitoring, organizations can achieve a more robust and effective data management strategy, ensuring real-time responsiveness and long-term reliability.
Essential Features to Look for in Data Observability Tools
When evaluating data observability tools, it’s important to consider features that ensure the integrity, reliability, and availability of your data. Here are the key features to look for in data observability tools:
Real-time Monitoring and Alerting
Real-time monitoring and alerting are crucial for maintaining the health of data systems. This feature allows organizations to continuously track data flows and system performance. By providing instant notifications of anomalies or issues, real-time monitoring helps prevent data-related problems before they escalate. This proactive approach ensures that data remains accurate and reliable.
End-to-End Data Lineage
End-to-end data lineage provides a comprehensive view of the data’s journey from source to destination. This feature helps in understanding data dependencies and tracing data transformations across the entire pipeline. By visualizing data lineage, organizations can quickly identify the root cause of data issues, ensure compliance, and improve data governance.
Automated Anomaly Detection
Automated anomaly detection uses advanced algorithms to identify unusual patterns or deviations in data. This feature helps in promptly detecting data quality issues such as missing values, duplicates, or outliers. Automated anomaly detection reduces the need for manual monitoring, allowing data teams to focus on more strategic tasks while ensuring data integrity.
Root Cause Analysis
Root cause analysis is essential for diagnosing and resolving data issues. This feature enables organizations to trace back the origin of data problems, whether they stem from data entry errors, system failures, or integration issues. By understanding the root cause, organizations can implement effective solutions and prevent similar issues in the future.
Integration Capabilities
Integration capabilities allow data observability tools to connect seamlessly with various data sources, platforms, and applications. This feature ensures that the tool can ingest and analyze data from different environments, providing a unified view of the data landscape. Strong integration capabilities enhance the tool’s flexibility and scalability, making it easier to adapt to changing business needs.
By focusing on these essential features, organizations can choose data observability tools that best meet their requirements, ensuring robust data management and operational efficiency.
What Challenges Are Data Observability Tools Solving?
Data observability tools tackle several key challenges in managing and maintaining data systems:
Ensuring Data Quality
These tools continuously monitor for anomalies and errors, ensuring data remains accurate and reliable for decision-making.
Rapid Issue Resolution
Real-time alerts and insights help data teams quickly identify and address problems, minimizing downtime and maintaining system reliability.
Managing Complex Data Environments
With multiple data sources and integrations, these tools provide a unified view of data flows, simplifying troubleshooting and maintenance.
Enhancing Compliance
Detailed data lineage and audit trails support data governance, making it easier to meet regulatory requirements.
Reducing Costs
Automation of monitoring and troubleshooting reduces the need for manual intervention, cutting operational costs and improving efficiency.
Supporting Decision-Making
By ensuring high-quality data, these tools enable organizations to make informed, data-driven decisions confidently.
In summary, data observability tools are essential for maintaining data integrity, improving operational efficiency, and supporting regulatory compliance.
List of 10 Best Data Observability Tools in 2026
In 2026, data observability tools continue to play a critical role in ensuring data integrity and reliability. Here are the top 10 data observability tools trusted by leading tech companies, each with unique features and benefits.
1. DataBuck
About: DataBuck data observability platform is designed to monitor data across lakes, warehouses, and pipelines. It autonomously identifies critical data issues before they impact operations, making it a valuable tool for data engineers.
Pros:
- Autonomously monitors data health
- AI/ML-driven error detection
- Reduces data maintenance costs
Best for Enterprises looking for a robust, AI-driven observability solution.
Features:
- Autonomous Monitoring: DataBuck continuously observes data at every stage, from the lake to the warehouse, detecting and alerting on critical issues.
- AI/ML Integration: Leveraging advanced machine learning, it identifies hard-to-detect errors without the need for manual rule writing.
- Unified Platform: Unlike many tools that only monitor data warehouses, DataBuck spans the entire data pipeline, providing comprehensive observability.
- User-Friendly: Designed for both data engineers and business stakeholders, it offers plug-and-play functionality and self-service capabilities.
- Cost Efficiency: By preventing data issues early, it significantly reduces maintenance costs and enhances productivity.
DataBuck stands out as a top investment for data observability, offering a unified, AI-driven platform that ensures data reliability and simplifies the monitoring process.
2. Monte Carlo Data
About: Monte Carlo Data is known for its end-to-end data observability platform that ensures data reliability across various pipelines.
Pros:
- Automated data anomaly detection
- Real-time data monitoring
Cons:
- High cost for smaller organizations
Best for: Large enterprises with complex data environments.
Features:
- Data quality monitoring
- Incident management
- Data lineage tracking
- Root cause analysis
3. Acceldata
About: Acceldata offers a comprehensive data observability cloud solution, focusing on monitoring, analyzing, and managing data efficiently.
Pros:
- User-friendly interface
- Automated reliability checks
Cons:
- Limited customization options
Best for: Organizations needing real-time insights into data operations.
Features:
- Multi-layered data analysis
- End-to-end data lineage
- Reliability checks
- Integration with multiple platforms
4. Appdynamics Business Observability Platform
About: Appdynamics, part of Cisco, provides a business observability platform that connects app performance with business outcomes.
Pros:
- Strong integration capabilities
- Real-time root cause analysis
Cons:
- Steep learning curve
Best for: Enterprises focused on application performance and customer experience.
Features:
- Real-time performance monitoring
- Security vulnerability detection
- Smart code instrumentation
- Multi-environment integration
5. Amazon CloudWatch
About: Amazon CloudWatch is a monitoring and observability service for AWS resources, providing data collection and real-time insights.
Pros:
- Easy integration with AWS services
- Scalable monitoring solutions
Cons:
- Limited to AWS ecosystem
Best for: Organizations using AWS infrastructure.
Features:
- Real-time monitoring and alerting
- Telemetry data collection
- Anomaly detection using ML
- Custom dashboards and reports
6. Datadog
About: Datadog offers a unified observability platform with extensive integrations and real-time data monitoring capabilities.
Pros:
- Wide range of integrations
- User-friendly interface
Cons:
- Can be expensive for extensive use
Best for: Companies needing comprehensive monitoring across various systems.
Features:
- Full-stack monitoring
- Real-time anomaly detection
- Synthetic monitoring
- Customizable dashboards
7. Dynatrace
About: Dynatrace provides an AI-powered observability platform that supports cloud environments with automatic root-cause detection.
Pros:
- AI-driven insights
- Extensive technology support
Cons:
- High licensing costs
Best for: Large enterprises with extensive cloud infrastructure.
Features:
- AIOps for predictive analytics
- Real-time topology mapping
- Distributed tracing
- Automated data collection
8. Elastic Observability
About: Elastic Observability, built on the Elastic Stack, offers robust logging, monitoring, and APM capabilities.
Pros:
- Flexible pricing model
- Strong community support
Cons:
- Can be resource-intensive
Best for: Organizations needing customizable and scalable observability solutions.
Features:
- Centralized logging and monitoring
- Real-time data visualization
- Anomaly detection
- APM and infrastructure monitoring
9. New Relic One
About: New Relic One is a comprehensive observability platform with a wide range of tools for monitoring infrastructure, applications, and logs.
Pros:
- Extensive monitoring capabilities
- Free tier for basic use
Cons:
- Can be complex to configure
Best for: Enterprises looking for an all-in-one observability solution.
Features:
- Full-stack observability
- Real-time alerting
- Custom dashboards
- AI-driven insights
10. Splunk Observability Cloud
About: Splunk Observability Cloud provides a unified platform for real-time monitoring and analysis of data across various systems.
Pros:
- Powerful data analytics
- Comprehensive monitoring tools
Cons:
- High cost for extensive use
Best for: Large enterprises with diverse data sources.
Features:
- Real-time data collection
- Anomaly detection
- Customizable dashboards
- Integration with various data sources
Additional Tools to Consider
While the above tools are among the best in the market, other notable mentions include Sumo Logic, Grafana, and Prometheus, each offering unique features and benefits suitable for different organizational needs.
By choosing the right data observability tool, organizations can ensure data integrity, improve operational efficiency, and gain valuable insights into their data systems.
Data Observability Tools for Different Environments
Different cloud environments require specific observability tools to ensure optimal performance and reliability. Below, we explore the best data observability tools tailored for Google Cloud Platform (GCP), Microsoft Azure, and Amazon Web Services (AWS).
Data Observability Tools for GCP
Google Cloud Platform (GCP) offers several observability tools designed to monitor and manage data across its services. Key tools include:
- Google Cloud Operations Suite (formerly Stackdriver): Provides monitoring, logging, and diagnostics for applications on GCP and other cloud environments. It helps in tracking metrics, managing logs, and setting up alerts for various GCP services.
- BigQuery Data Transfer Service: Automates data movement into BigQuery on a scheduled and managed basis, making it easier to integrate data from different sources and monitor the data flow.
- Datadog: Integrates well with GCP, offering comprehensive monitoring and observability for applications hosted on Google Cloud. It includes features like real-time data monitoring, anomaly detection, and integration with other GCP services.
GCP users benefit from these tools by gaining real-time insights into their data operations, ensuring high availability and performance of their cloud resources.
Data Observability Tools for Azure
Microsoft Azure provides a range of observability tools to monitor and manage data within its cloud ecosystem. Essential tools include:
- Azure Monitor: A comprehensive solution for collecting, analyzing, and acting on telemetry data from Azure and on-premises environments. It helps in identifying and resolving issues through real-time monitoring and alerting.
- Azure Log Analytics: Part of Azure Monitor, this tool allows users to query and analyze log data from various sources. It helps in detecting anomalies, troubleshooting issues, and maintaining system health.
- Application Insights: Provides performance management and monitoring for live web applications, helping to detect and diagnose performance issues and understand usage patterns.
Azure users can leverage these tools to maintain the integrity and performance of their data systems, ensuring seamless operation across their cloud infrastructure.
Data Observability Tools for AWS
Amazon Web Services (AWS) offers robust observability tools to ensure the health and performance of applications and data. Key tools include:
- Amazon CloudWatch: A monitoring and observability service that provides data and actionable insights for AWS, hybrid, and on-premises applications and infrastructure resources. It includes features like alarms, dashboards, and automatic scaling.
- AWS X-Ray: Helps developers analyze and debug distributed applications, such as those built using microservices architecture. It enables tracing requests as they travel through the application.
- Datadog: A popular choice for AWS users, offering comprehensive monitoring, security, and observability for applications running on AWS. It integrates seamlessly with various AWS services, providing real-time insights and anomaly detection.
AWS users benefit from these tools by achieving comprehensive visibility into their applications and infrastructure, ensuring high performance and reliability.
By selecting the right data observability tools for their cloud environment, organizations can enhance their data management practices, improve operational efficiency, and ensure robust performance across their cloud resources.
Popular Open Source Data Observability Tools
Open source data observability tools provide a cost-effective and flexible way to monitor and manage data systems. These tools offer robust features and community support, making them a popular choice for many organizations. Here are some of the most widely used open source data observability tools:
- Prometheus: A powerful monitoring and alerting toolkit, Prometheus is widely used for recording real-time metrics and providing a robust query language for retrieving data.
- Grafana: Often paired with Prometheus, Grafana excels in visualizing complex data metrics and creating interactive dashboards.
- Elasticsearch, Logstash, and Kibana (ELK Stack): This trio provides comprehensive logging and search capabilities, helping organizations aggregate and analyze large volumes of log data.
- OpenTelemetry: An observability framework for cloud-native software, OpenTelemetry provides APIs and tools to collect metrics, logs, and traces.
- Jaeger: A popular tool for tracing and monitoring microservices, Jaeger helps in understanding the performance and troubleshooting issues within distributed systems.
These tools offer a range of features that cater to different aspects of data observability, from metrics collection to log management and distributed tracing.
Benefits of Open Source Observability Tools
Open source observability tools come with several advantages that make them a preferred choice for many organizations:
- Cost-Effective: Open source tools typically have no licensing fees, reducing the overall cost of implementing data observability solutions.
- Flexibility: These tools can be customized to meet specific needs, allowing organizations to modify and extend functionalities as required.
- Community Support: A strong user community provides extensive documentation, forums, and updates, helping users troubleshoot issues and stay updated with the latest features.
- Interoperability: Open source tools often integrate well with other software and platforms, providing a cohesive observability solution.
- Transparency: With open source tools, organizations have full visibility into the code, ensuring transparency and security in their observability solutions.
By leveraging open source data observability tools, organizations can maintain high levels of data integrity, improve system performance, and reduce operational costs.
How to Choose the Best Data Observability Tool for Your Business Needs?
Choosing the right data observability tool is crucial for ensuring data quality and operational efficiency. Below are key considerations and criteria to help you select the best tool for your business.
Key Considerations and Criteria
When evaluating data observability tools, consider the following factors:
- Data Sources: Ensure the tool supports all your data sources and can handle diverse data environments.
- User Needs: Identify who will use the tool (data engineers, analysts, etc.) and ensure it meets their requirements.
- Features: Look for essential features such as real-time monitoring, anomaly detection, and data lineage.
- Support and Community: A tool with strong support and an active community can provide valuable resources and assistance.
Enterprise Readiness
Enterprise readiness is critical for large organizations that require robust, scalable solutions. A good enterprise-ready observability tool should offer:
- Scalability: The ability to handle large volumes of data and support numerous users simultaneously.
- Security: Comprehensive security features to protect sensitive data, including encryption and access controls.
- Compliance: Tools that help meet regulatory requirements and provide audit trails for data governance.
Ease of Integration
Seamless integration with your existing data infrastructure is essential. Consider the following:
- Compatibility: Ensure the tool is compatible with your current systems, including databases, data warehouses, and cloud platforms.
- APIs and Connectors: Look for tools with robust APIs and connectors that facilitate easy integration with various data sources and third-party applications.
- Implementation Time: Choose a tool that can be deployed quickly without extensive configuration or custom development.
Scalability
Scalability ensures that the tool can grow with your business. Key aspects include:
- Performance: The tool should maintain high performance even as data volume and user numbers increase.
- Resource Management: Efficient use of resources to handle peak loads and varying data processing demands.
- Flexibility: The ability to scale both horizontally (adding more servers) and vertically (adding more power to existing servers) as needed.
Cost-effectiveness
Cost-effectiveness is a crucial factor for any business. Evaluate the following:
- Pricing Model: Understand the pricing model (subscription-based, pay-as-you-go, etc.) and ensure it aligns with your budget.
- Total Cost of Ownership (TCO): Consider the TCO, including license fees, implementation costs, and ongoing maintenance expenses.
- Return on Investment (ROI): Assess the potential ROI by evaluating how the tool can improve efficiency, reduce errors, and lower operational costs.
By carefully considering these factors, you can select a data observability tool that meets your business needs, supports your data management goals, and provides long-term value.
Real-World Use Cases of Data Observability Tools
Data observability tools are essential in today’s data-driven businesses, offering real-world solutions to various challenges. Here are some practical examples of how businesses benefit from implementing these tools.
How Do Businesses Benefit from Data Observability?
Businesses across industries leverage data observability tools to enhance data quality, improve operational efficiency, and gain actionable insights. Here are some specific benefits observed in real-world applications:
- Improved Data Quality: Organizations use data observability tools to continuously monitor and validate data, ensuring high quality and accuracy. This helps in making better business decisions based on reliable data.
- Reduced Downtime: By detecting anomalies and potential issues in real-time, these tools help prevent data pipeline failures and reduce system downtime, leading to smoother operations.
- Enhanced Compliance: Data observability tools provide detailed data lineage and audit trails, making it easier for businesses to comply with regulatory requirements and internal policies.
- Cost Savings: Early detection of data issues prevents costly downstream problems, reducing the resources needed for data maintenance and correction.
Success Stories With Data Observability Tools
Case Study 1: Telecommunications
The finance team of a leading telecom company was overwhelmed by data inconsistencies. Data from multiple sources entered the financial systems, making reconciliation a nightmare.
This chaos led to missed deadlines for financial reporting and widespread frustration across the board.
With DataBuck, 700+ files are validated daily, reducing errors by 75% and reconciliation time reducing by 80%.
Now, they meet deadlines with confidence – no anxiety, no late nights.
If improving data quality is on your radar, DataBuck can help.
Case Study 2: Manufacturing
A global automotive manufacturer was struggling with inaccurate vehicle delivery data, leading to missed ETAs, frustrated dealers and customers, and costly inefficiencies in their operations.
With real-time monitoring and precision error detection, DataBuck automated data reconciliation across platforms. The results were transformational:
- 90% improvement in model accuracy
- 4X reduction in manual correction efforts
- 94% cost savings in data validation
Dealers/Distributors received accurate ETAs, while the operations team gained peace of mind- no more chaos, just confidence.
See DataBuck Data Quality Software in action and transform your supply chain data quality.
Case Study 3: Financial Services
A top-3 US bank was drowning in data issues—manual processes, recurring errors, and compliance risks strained their 200-person DQ team to its limits. Legacy tools couldn’t handle large datasets, resulting in slow, error-prone reporting.
With DataBuck:
- 1B+ row tables validated in 30 minutes (vs. 24+ hours).
- 50% cost savings in data quality management.
- 90% faster onboarding of datasets.
- Processing speed increased by 10x.
Now, their analytics and reporting are error-free, compliant, and efficient—without the chaos.
See how DataBuck can transform your financial data quality.
These real-world examples highlight the transformative impact of data observability tools, showcasing how businesses across different sectors achieve significant benefits by adopting these solutions.
The Future of Data Observability Tools
The future of data observability is shaped by advancements in technology and the growing complexity of data environments. Here are key trends:
Increased Use of AI and Machine Learning
AI and ML are enhancing data observability by automating anomaly detection and predicting issues. These technologies will provide deeper insights, allowing for more strategic human intervention (Grafana Labs) (Sapphire Ventures).
Adoption of Open Standards
Open standards like OpenTelemetry (OTel) are becoming more prevalent, ensuring interoperability and reducing vendor lock-in. This standardization simplifies integration across diverse systems (Sapphire Ventures) (Elastic).
Focus on Cost Management
Managing the costs associated with growing data volumes is crucial. Future tools will offer better control over data collection and storage, helping organizations optimize their observability budgets (Grafana Labs).
Enhanced Security and Compliance
Security and compliance will be integral to data observability tools, offering robust encryption, access controls, and compliance tracking to meet regulatory requirements (Sapphire Ventures).
Integration with CI/CD Pipelines
Integrating observability into CI/CD pipelines helps identify and resolve issues early in development, improving application reliability and performance (Grafana Labs).
Real-time Data Analytics
Enhanced capabilities for real-time data visualization and analysis will enable quicker issue identification and faster decision-making, essential for dynamic data environments (Logz.io).
By embracing these trends, organizations can maintain efficient and secure data systems, ready for future challenges.
Monitor 100% of Your Data with DataBuck’s Advanced Observability Tool
FirstEigen’s DataBuck observability tool stands out by providing comprehensive and autonomous data monitoring. Designed to ensure the health and reliability of your data, DataBuck monitors every aspect of your data pipeline, from value distribution and record volume to data freshness and file structure changes.
Key Features of DataBuck:
- Comprehensive Monitoring: DataBuck covers every stage of your data pipeline, ensuring no data is left unchecked. This includes data lakes, warehouses, and pipelines, providing a unified monitoring solution.
- Autonomous Validation: Leveraging AI/ML, DataBuck autonomously validates data quality, catching 100% of system risks. This minimizes the need for manual intervention, allowing your team to focus on strategic tasks.
- Real-time Alerts: The tool provides real-time alerts for any deviations in data, ensuring prompt actions to rectify issues and maintain data integrity.
- Efficiency and Cost Savings: With thousands of validation checks performed in minutes, DataBuck significantly reduces the labor and time required for data validation, potentially saving up to 80% of data validation labor costs.
- Compatibility: DataBuck integrates seamlessly with various data environments, making it a versatile choice for businesses of all sizes and sectors.
Benefits:
- Enhanced Data Quality: Ensures that your data is accurate, fresh, and reliable, facilitating better decision-making.
- Operational Efficiency: Automates data validation processes, reducing manual workload and increasing productivity.
- Cost-effective: By cutting down on manual validation labor and catching issues early, DataBuck helps in reducing overall operational costs.
With FirstEigen’s DataBuck, businesses can confidently monitor 100% of their data, ensuring that all data assets are reliable and ready for use, thereby supporting robust data-driven strategies.
Elevate Your Organization’s Data Quality With DataBuck by FirstEigen
DataBuck enables autonomous data quality validation, catching 100% of systems risks and minimizing the need for manual intervention. With 1000s of validation checks powered by AI/ML, DataBuck allows businesses to validate entire databases and schemas in minutes rather than hours or days.
To learn more about DataBuck and schedule a demo, contact FirstEigen today.
Check out these articles on Data Trustability, Observability & Data Quality Management-
- Best Practices for Data Quality Management
- Data Catalog Tools for Enterprises
- Complete Guide to Understanding Data Observability
- Monitoring vs Observability
- Data Observability for Data Engineering
- Data Quality Issues in Healthcare
- Observability Data Lake
Did You Find This Helpful?
Thanks you for response.
FAQs
A data observability platform is a tool designed to monitor and analyze the health and performance of data systems. It provides insights into data quality, data lineage, and system reliability. By continuously tracking data flows and detecting anomalies, it helps ensure that data is accurate, consistent, and available when needed.
Discover How Fortune 500 Companies Use DataBuck to Cut Data Validation Costs by 50%
![]()
Enter your email address to access to downloads
Recent Posts

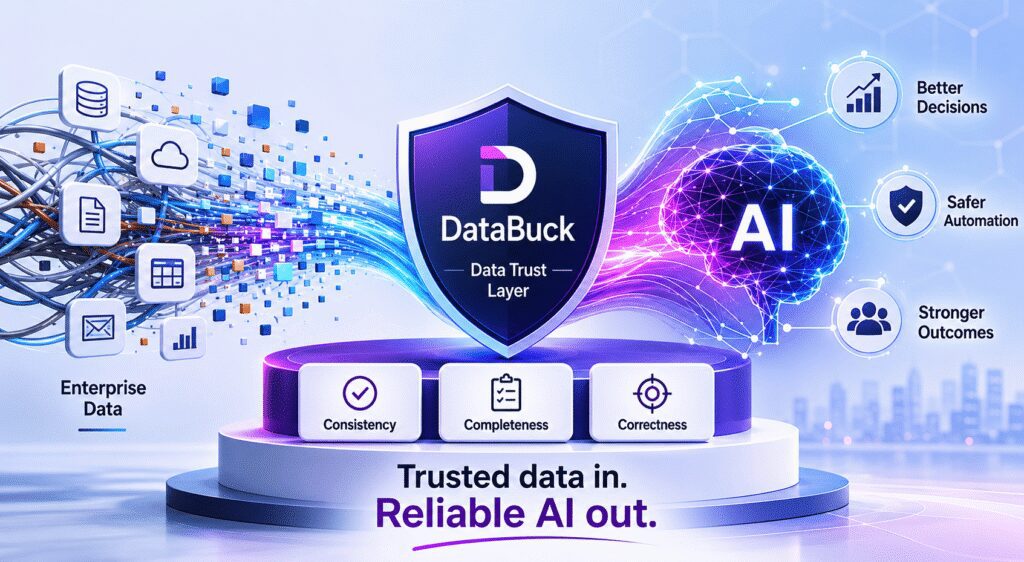
The Power of Data Quality for AI Success
AI agents are only as reliable as the data they act on. As enterprises race to deploy AI, data quality has quietly become the deciding factor between success and costly failure. The Problem Nobody Is Solving Most AI conversations…
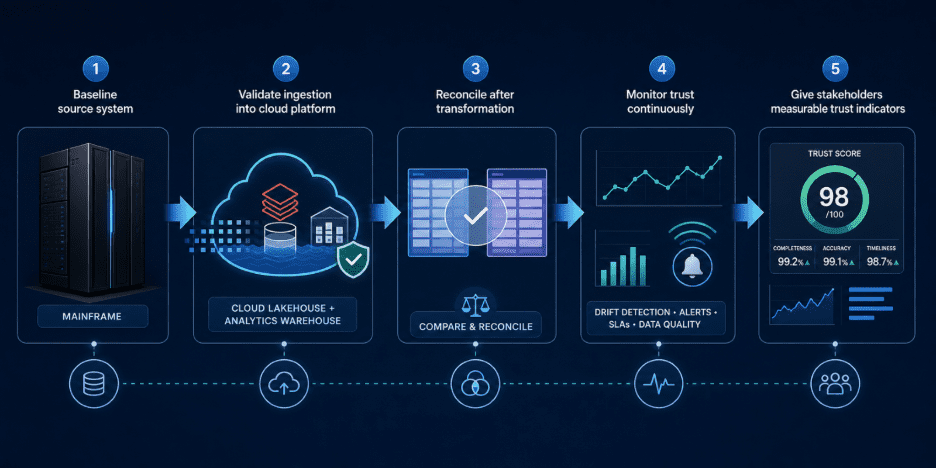
Mainframe Data Reconciliation for Cloud Migration
Cloud migration is no longer just an infrastructure decision. For data leaders and data engineers, it is a trust decision. …
What Do Failed AI Projects Have in Common?
Most AI failures are not model failures — they are data, governance, operational trust, and weak AI-ready foundations. “AI alone is not the solution – trusted, validated, continuously governed data is the…
Bad Data Is Costing You More Than You Think

Would you like to tell us why?