
Seth Rao
CEO at FirstEigen
The Complete Guide to Understanding Data Observability
Before diving deeper, let’s begin with a data observability definition to understand its role in ensuring data accuracy and reliability.
What is Data Observability and Why Does It Matter?
Data observability is the ability to monitor your system’s data, identify data-related issues, and rectify those issues. It’s about observing and understanding the health of your data and ensuring that identified errors do not reoccur. The goal of data observability is to guarantee a reliable flow of high-quality data throughout your organization, thus reducing downtime and improving both short- and long-term decision-making.
How Does Data Observability Work?
Data observability works by continuously tracking data as it moves through complex pipelines. It collects performance metrics from infrastructure, data, and application layers, offering real-time insights into data quality and system health.
By monitoring user-defined metrics, data observability identifies anomalies, data inconsistencies, and potential issues, allowing for quick resolution and maintaining data reliability across the entire system. This proactive approach ensures that data remains accurate, consistent, and trustworthy, supporting better decision-making and operational efficiency.
How Does Data Observability Differ From Data Monitoring?
To the uninitiated, data observability and data monitoring might seem like two ways of describing the same activity. In reality, data observability and data monitoring are closely related but subtly different.
Data monitoring examines data in your pipeline with the goal of identifying poor quality data and taking steps to remediate it. Data monitoring tools look especially for data that is incomplete, inaccurate, or doesn’t adhere to defined standards. It essentially asks the question “what’s broken and how can we fix it?”
Data observability goes beyond basic data monitoring to understanding the data being monitored. It examines not just the quality of the data but also its lineage and schema to provide insight into why it is as it is. It adds the question “why?” to the questions asked in data monitoring.
In fact, data observability can enable more accurate and efficient data monitoring and data quality management. By providing a better understanding of why particular data behaves in a certain way, you can better design data monitoring tools to look for specific data quality issues. While data monitoring does a good job looking for pre-defined issues, data observability helps identify new and evolving issues.
(The following video discusses the differences between data monitoring and data observability.)
Understanding Data Observability Metrics
Data observability metrics are like gauges on a car dashboard, revealing your data system’s health. Key metrics include:
- Freshness: Ensures you have up-to-date data for analysis.
- Volume: Unexpected changes can indicate data duplication or missing sources.
- Distribution: Skewed data distribution can impact analysis accuracy.
- Schema: Monitors changes to data structure to avoid broken pipelines.
- Lineage: Tracks data origin and transformation to identify processing errors.
These metrics help you:
- Spot potential issues: Proactively identify problems before they impact data quality.
- Optimize pipelines: Analyze volume and latency to identify bottlenecks for faster processing.
- Ensure data quality: Track freshness, schema changes, and lineage for consistent data.
By understanding these core metrics, you gain valuable insights to ensure reliable and high-quality data.
What Are the 5 Pillars of Data Observability?
The five pillars form the foundation of data observability, guiding the evaluation of data health and reliability.
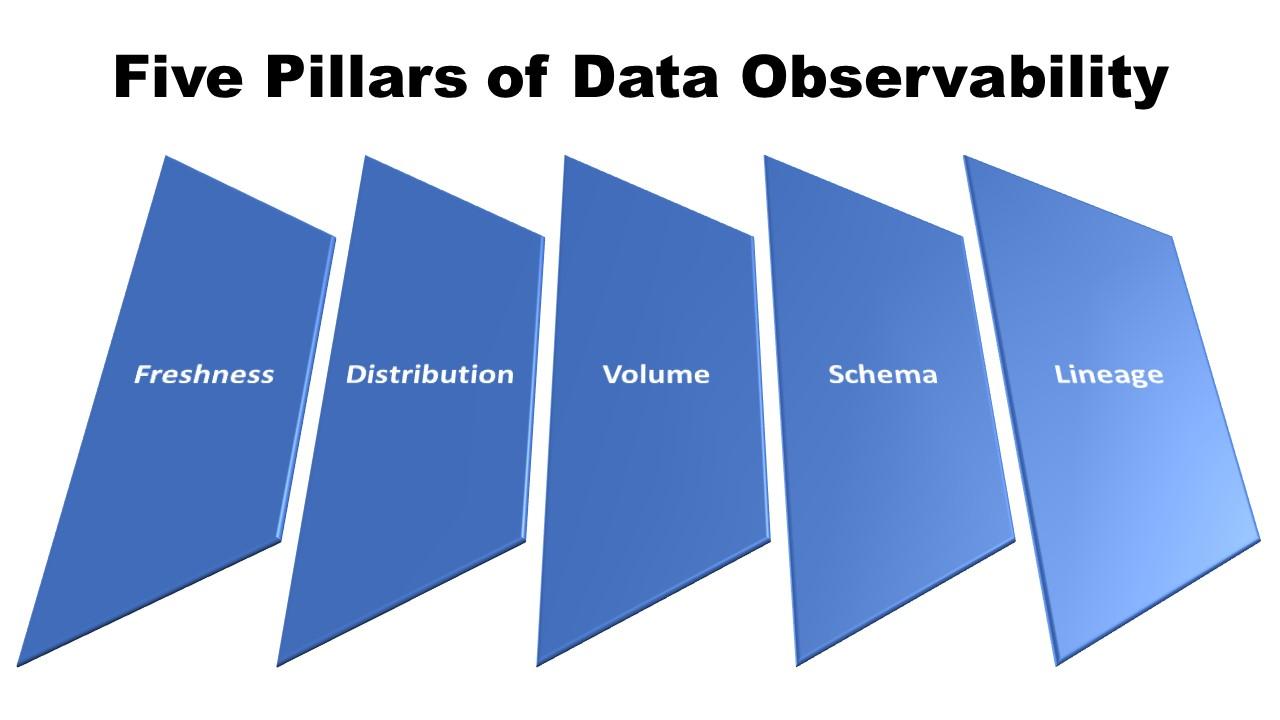
1. Freshness
Freshness (sometimes referred to as timeliness) concerns how recent a piece of data is. The goal is to use the most up-to-date data, knowing that data quality erodes over time. For example, customer information becomes less relevant over the years as people move, change email addresses, age, and experience lifestyle changes. Using older data will produce poorer results than working with more timely data.
2. Distribution
In this instance, distribution refers to the expected range of a set of data. If data points do not fall within an acceptable range, that may indicate data quality issues.
3. Volume
Tracking the consistency of data flow can help identify data pipeline issues. Erratic data volume can indicate problems with data intake.
4. Schema
Schema refers to how data is organized, such as the fields and tables in a database. Observing changes in schema can indicate broken data, often caused by someone making unauthorized changes to the data structure.
5. Lineage
Data observability pays particular attention to data lineage—that is, the history of a data set. A detailed lineage records every step in the data’s path, include data sources, transformations, and downstream destinations. It provides a complete picture of your firm’s data landscape.
Tracking data lineage helps identify where issues occur and why. It’s important for data governance, regulatory, compliance, and ensuring that the data is trustworthy.
Other Important Issues
Beyond the five pillars, data observability is also concerned with understanding:
- Data quality
- Data completeness
- Data security and privacy
- Data compliance
The first two of these issues are also in the purview of data monitoring, which reflects how these two activities often serve the same goals.
Why is Data Observability Important?
As the volume of data continues to grow, companies and organizations are expected to ensure the quality and usability of that data. According to IDC, more than 64 zettabytes (ZB) of data were created in 2020. The company expects the amount of data created to grow at a compound annual growth rate (CAGR) of 23% through 2025.

Much of this newly created data is not unique and instead replicated for consumption and analysis throughout an organization. IDC estimates that the ration of unique to replicated data is 1:9, which means that a typical organization will generate nine times as much data as it initially ingests.
Ensuring the accuracy, consistency, and reliability of this data is a significant challenge which can only be met by the use of sophisticated data monitoring and data observability tools. This is why 90% of IT decision makers say that data observability is both important and strategic to their business.
Essential Components of Data Observability Architecture
A strong data observability architecture is like a well-oiled machine, ensuring all parts work together to monitor your data health. Here are the key components:
- Data Collection Tools: These tools gather data from your pipelines, warehouses, and applications. They track metrics like data freshness, volume, errors, and schema changes.
- Data Storage and Processing Engine: This component stores the collected data and performs analysis to identify trends and anomalies.
- Alerting and Notification System: This system sends alerts to data engineers or analysts when potential issues are detected.
- Data Visualization Tools: These tools allow you to visualize data observability metrics in dashboards and reports for easy understanding.
- Root Cause Analysis Tools: These tools help you investigate the root cause of data issues, enabling faster troubleshooting and resolution.
By integrating these components, you create a comprehensive system for monitoring your data health and ensuring the quality of your data.
Why Monitoring Data Pipelines is Crucial for Data Quality
Data pipelines are the highways that transport your data from source to destination. Just like a clogged highway can delay deliveries, issues in your data pipelines can lead to poor data quality. Here’s why monitoring pipelines is essential:
- Ensures Data Freshness: You can track how long it takes data to flow through the pipeline and identify delays that might lead to outdated data.
- Detects Data Errors: Monitoring can identify errors like missing data, incorrect data formats, or unexpected changes in data volume.
- Improves Data Lineage: By tracking the flow of data through the pipeline, you can understand where data comes from and how it’s transformed, making it easier to trace the root cause of issues.
- Optimizes Performance: Monitoring helps identify bottlenecks in your pipeline and allows you to optimize data processing for faster and more efficient data flow.
By proactively monitoring your data pipelines, you can prevent data quality issues from impacting your analytics and decision-making.
Developing a Strong Data Observability Framework
A strong data observability framework is your roadmap for achieving and maintaining data quality. Here are some key steps to consider:
- Define Your Data Quality Goals: Identify what aspects of data quality are most important to your business.
- Map Your Data Landscape: Understand the different data sources, pipelines, and systems that contribute to your data ecosystem.
- Choose Data Observability Tools: Select tools that align with your needs and can monitor all relevant data sources.
- Establish Monitoring Practices: Define clear procedures for collecting data, setting alerts, and investigating issues.
- Promote Collaboration: Foster communication between data teams and business users to ensure data observability insights are actionable.
- Continuously Improve: Regularly review your data observability practices and adapt them as your data needs evolve.
By implementing a well-defined framework, you can ensure data observability becomes an ongoing practice that drives data quality and empowers data-driven decision making within your organization.
Key Benefits of Data Observability for Modern Organizations
Embracing data observability offers significant advantages to any organization. By providing a 360-degree view of your data, data observability provides the following benefits:
1. Improves Data Quality
Data observability, much like data monitoring, helps improve the quality and integrity of your business’ data. It helps identify and resolve data quality issues.
2. Ensures Data Consistency
By monitoring data flow across your organization, data observability helps to ensure data consistency throughout the entire data pipeline.
3. Provides More Accurate Reporting and Analysis
The more accurate data resulting from the use of data observability improves the quality and reliability of your firm’s reporting. This, in turn, provides more accurate analysis of your business operations and help you make better informed business decisions.
4. Enhances Operating Efficiency
Higher-quality and more reliable data also improves your organization’s operating efficiency. This results in more uptime and enhanced operational performance.
5. Builds Trust in the Data
Ultimately, embracing data observability helps you better understand and better trust the data that your business relies on. Instead of questioning the data, you can now trust it to be fresh and accurate.
Exploring Data Observability Features
Data observability platforms offer a range of features to help you monitor and understand your data health. Here are some key capabilities to consider:
- Automated Data Collection: Look for tools that automatically collect data observability metrics from your data sources without requiring manual configuration.
- Real-Time Monitoring: Gain instant insights into your data health with features that display data observability metrics in real-time dashboards.
- Alerting and Notification: Set up customizable alerts to be notified of potential issues based on specific metrics or thresholds you define. This allows for early intervention and quicker resolution of problems.
- Root Cause Analysis Tools: Some platforms offer features that help you drill down and identify the root cause of data quality issues, saving you time and effort in troubleshooting.
- Data Visualization Tools: Visualize data observability metrics in charts and graphs for easier understanding and identification of trends or anomalies.
- Historical Data Analysis: Track data observability metrics over time to identify patterns and assess the overall health of your data over longer periods.
Cut Data Quality Costs by 50% with AI-Powered Observability
Selecting the Best Data Observability Platform for Your Business
Selecting the best data observability platform for your business involves considering several factors:
- Data Sources: Identify the data sources you need to monitor, such as data pipelines, warehouses, lakes, and applications. Choose a platform that supports all your relevant data sources.
- Data Volume and Complexity: Consider the amount of data you manage and the complexity of your data pipelines. Platforms should handle your data volume efficiently and offer features for complex data structures.
- Alerting and Notification Features: Ensure the platform offers customizable alerts that notify you of potential issues based on your specific needs.
- Scalability: Choose a platform that can scale with your growing data volume and evolving data needs.
- Ease of Use: Evaluate the platform’s user interface and consider how easy it is to set up, use, and maintain for your team.
- Cost: Compare pricing models and features offered by different vendors to find a solution that fits your budget.
Additional Considerations:
- Integrations: Does the platform integrate with your existing data tools and analytics platforms?
- Security: Ensure the platform offers robust security features to protect your sensitive data.
- Vendor Support: Evaluate the level of support offered by the vendor, including documentation, training, and ongoing assistance.
By carefully considering these factors, you can choose a data observability platform that effectively monitors your data health, improves data quality, and empowers you to make data-driven decisions with confidence.
Top Challenges in Data Observability and How DataBuck Can Help
Data observability is crucial for ensuring data quality, but there are challenges that can hinder its effectiveness. Here are some of the main obstacles, along with how DataBuck’s AI/ML-powered platform can help overcome them:
1. Challenge: Limited Scope of Existing Tools
Many data observability tools focus primarily on monitoring data warehouses like Snowflake. This neglects the broader data ecosystem, which includes data lakes and pipelines that act as the foundation for your data journey.
DataBuck’s Solution: Unified Platform
DataBuck provides a unified platform that goes beyond data warehouses. It monitors your entire data landscape, including data lakes and pipelines, offering a complete picture of your data health.
2. Challenge: Manual Rule Writing
Setting up traditional data observability tools often involves writing complex rules to define what constitutes an issue. This can be time-consuming and prone to human error.
DataBuck’s Solution: AI/ML Automation
DataBuck leverages AI and machine learning to automatically understand your data patterns and expectations. It identifies anomalies and deviations without requiring manual rule writing, saving data engineers valuable time and effort.
3. Challenge: Identifying Hard-to-Detect Errors
Some data errors can be subtle and difficult to catch with traditional monitoring methods. These hidden errors can significantly impact data quality if left undetected.
DataBuck’s Solution: Advanced AI/ML Detection
DataBuck’s AI/ML algorithms are specifically designed to identify even hard-to-detect errors in your data. This proactive approach ensures you catch issues early before they cause downstream problems.
Here’s how DataBuck can benefit you with quantifiable results:
- Cost Reduction: By catching errors early, DataBuck helps you avoid the snowball effect of fixing issues further down the pipeline, potentially saving your organization 10 times the cost of fixing a late-stage error.
- Increased Efficiency: DataBuck’s automation features can cut data maintenance work and costs by over 50%, allowing your data team to focus on more strategic tasks.
- Scalability: DataBuck efficiently scales with your growing data volume, making it 10 times more efficient in managing data observability for thousands of data sets.
With its unified platform, AI/ML automation, and advanced error detection, DataBuck empowers you to overcome the challenges of data observability and achieve a significant return on investment.
Achieve 10x Better Data Observability With DataBuck AI/ML Solution
Data Observability Insights: Differentiating Key Data Management Concepts
This section clarifies the relationship between data observability and other data management concepts.
1. Data Observability vs. Data Testing
- Data Testing: Focuses on validating data against predefined rules to ensure accuracy and consistency before it enters production systems.
- Data Observability: Continuously monitors the health and performance of data pipelines and systems in production. It helps identify issues that might slip through testing or emerge over time.
Read more about: Data Observability vs. Data Testing
2. Data Observability vs. Data Monitoring
- Data Monitoring: Tracks basic metrics like data flow and system uptime.
- Data Observability: Provides a more in-depth view, analyzing data freshness, schema changes, lineage, and other factors to understand the overall health and reliability of data.
3. Data Observability vs. Data Quality
- Data Quality: Refers to the overall accuracy, consistency, and completeness of data.
- Data Observability: Provides the tools and insights to assess and improve data quality by identifying potential issues and monitoring data health.
4. Data Observability vs. Data Reliability
- Data Reliability: Ensures data is consistently available, accurate, and meets specific business needs.
- Data Observability: Helps achieve data reliability by providing real-time insights into data health and enabling proactive problem identification.
5. Data Observability vs. Machine Learning Observability (MLOps)
- Data Observability: Focuses on the health of data pipelines and systems that feed machine learning models.
- Machine Learning Observability (MLOps): Monitors the performance and behavior of machine learning models themselves, including accuracy, drift, and fairness. These two aspects work together to ensure data-driven systems’ overall health and reliability.
A 5-Step Guide to Implementing Data Observability in Your Business
Data observability offers a powerful tool for ensuring the quality and reliability of your data. Here’s a practical guide to get you started:
1. Define Your Goals and Needs:
- Identify what aspects of data quality are most critical for your business (e.g., data accuracy, timeliness, completeness).
- Understand which data sources are most important to monitor (data lakes, warehouses, applications).
2. Map Your Data Landscape:
- Create a clear picture of your data ecosystem, including data sources, pipelines, and destinations.
- Identify potential bottlenecks or areas where data quality issues might arise.
3. Choose the Right Tools:
- Evaluate data observability platforms based on your needs, budget, and data volume.
- Look for tools that offer comprehensive monitoring across your entire data landscape.
4. Implement Data Collection and Monitoring:
- Set up data collection tools to capture relevant metrics from your data sources.
- Configure alerts to notify you of potential data quality issues based on your defined goals.
5. Refine and Continuously Improve:
- Regularly review your data observability practices and adjust them as needed.
- Use data observability insights to identify areas for improvement in your data management processes.
- Foster communication between data teams and business users to ensure data quality meets business objectives.
Who Benefits from Data Observability?
Data observability benefits a wide range of stakeholders within your organization:
- Data Engineers: Identify and resolve data quality issues faster, improving data pipeline efficiency.
- Data Analysts: Gain confidence in the accuracy of data used for analysis, leading to more reliable results.
- Business Users: Make data-driven decisions based on trustworthy information, improving overall business outcomes.
- Management: Gain better visibility into the health of their data infrastructure and make informed decisions about data investments.
By implementing data observability, you create a foundation for trust in your data, empowering everyone who relies on it to make better decisions.
Achieve 10x Results With DataBuck AI/ML Solution for Data Observability and Quality
Unified Platform for Effortless Monitoring: Overcome Observability Tool Limitations
When you aim to improve the quality of your firm’s data, turn to the experts at FirstEigen. Our autonomous data quality management platform, DataBuck, automates over 70% of the data monitoring process, making it an essential component of any data monitoring or data observability solution.
What do you gain?
- Cost Savings and Increased Productivity: Every step a data error propagates downstream, the cost to fix it increases by 10 times. By using DataBuck, you can cut these costs significantly and boost productivity.
- Autonomous Data Observation with AI/ML: DataBuck uses advanced AI and ML algorithms to observe data autonomously. This reduces data maintenance work and costs by over 50%.
- Efficient Scaling: DataBuck is 2x times more efficient in scaling data observability to thousands of data sets. This ensures robust data quality management even as your data grows exponentially.
With DataBuck, you can monitor data effortlessly, overcoming the limitations of traditional observability tools. Our unified platform provides real-time insights and automates data quality management, helping you maintain accurate and reliable data across your entire system.
Elevate Your Organization’s Data Quality With DataBuck by FirstEigen
DataBuck enables autonomous data quality validation, catching 100% of systems risks and minimizing the need for manual intervention. With 1000s of validation checks powered by AI/ML, DataBuck allows businesses to validate entire databases and schemas in minutes rather than hours or days.
To learn more about DataBuck and schedule a demo, contact FirstEigen today.
Check out these articles on Data Trustability, Observability & Data Quality Management-
Frequently Asked Questions
Observability data refers to the information collected about the health and performance of your data systems. This data includes metrics like data freshness, volume, distribution, schema changes, and lineage. By analyzing observability data, you can identify and troubleshoot issues that might affect the quality and reliability of your data.
Discover How Fortune 500 Companies Use DataBuck to Cut Data Validation Costs by 50%
![]()
Enter your email address to access to downloads
Recent Posts
What Do Failed AI Projects Have in Common?
Most AI failures are not model failures — they are data, governance, operational trust, and weak AI-ready foundations. “AI alone is not the solution – trusted, validated, continuously governed data is the…

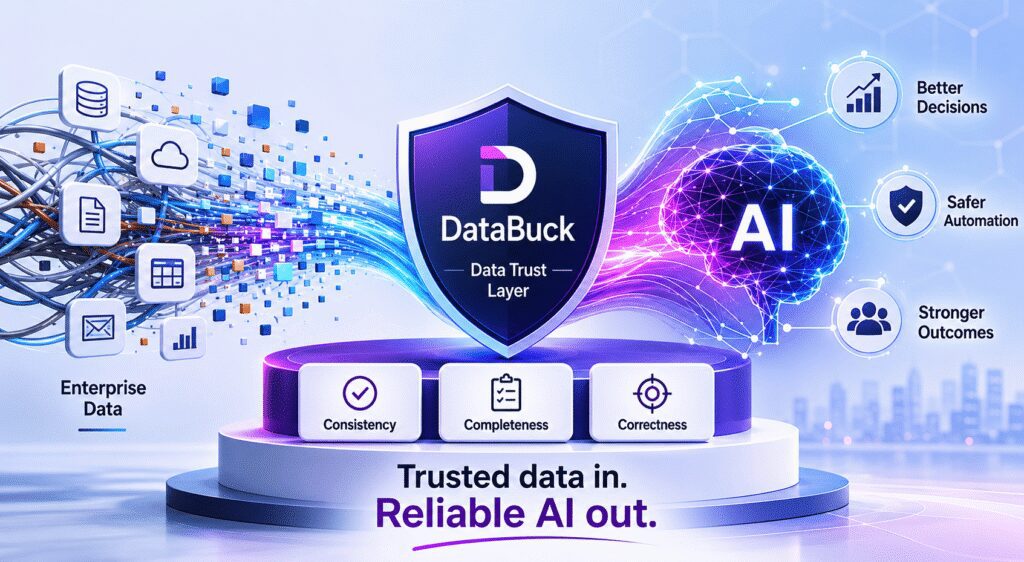
Why Data Trust Is the Real Foundation of AI Success
Enterprises are racing to adopt AI—LLMs, copilots, and autonomous agents that can trigger actions across systems. But as AI moves…
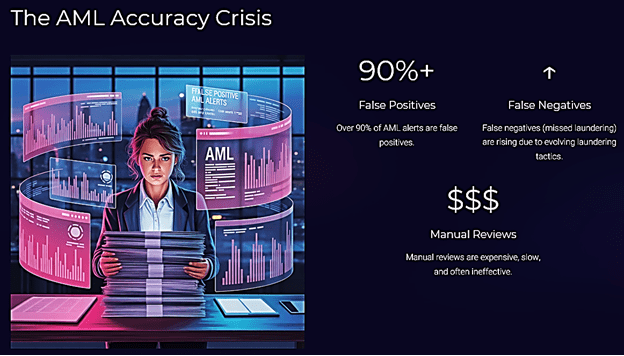
AI-Powered Data Quality Validation for Smarter AML Detection
Fraud, Anti-Money Laundering (AML) and counter-terrorist financing (CTF) programs are only as good as the data they consume. Advanced monitoring…
Bad Data Is Costing You More Than You Think