
Angsuman Dutta
CTO, FirstEigen
Anomaly Detection: A Key to Better Data Quality
Why Data Quality Matters and How Anomaly Detection Helps?
Maintaining data quality is important to any organization. One effective way to improve the quality of your firm’s data is to employ anomaly detection. This approach identifies data anomalies—outliers that are likely to be irrelevant, inaccurate, or problematic for analysis.
Understanding how anomaly detection works can help you improve your company’s overall data quality – and provide more usable data for better decision-making.
Quick Takeaways
- Anomaly detection improves data quality by identifying data points that deviate from expected patterns.
- Since outliers are likely to be poor-quality data, identifying them and isolating them improves overall data quality.
- Anomaly detection algorithms leverage machine learning, artificial intelligence (AI), and statistical methods to pinpoint data anomalies.
- Compared to traditional data monitoring methods, anomaly detection is more scalable and more easily handles heterogeneous data sources.
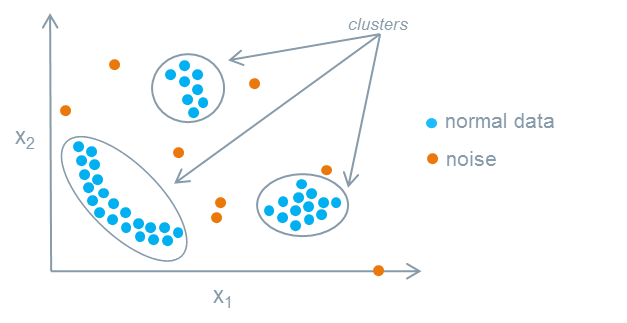
What Are Data Anomalies?
An anomaly is a data point that does not conform to most of the data. Data anomalies are unexpected values outside the expected data pattern – they’re deviations from the norm.
Anomalies can exist in any type of data. For example, in daily sales, a day with sales twice the norm is an anomaly. In manufacturing data, a sample that is significantly bigger or smaller or heavier or lighter than the other products is an anomaly. When looking at a customer database, an 87-year-old customer among a group of 20-somethings is an anomaly.
Data anomalies are not bad but could indicate the presence of inaccuracies, miscounts, incorrect placements, or simply wrong entries. Recognizing an anomaly reveals a data point that needs to be further examined to determine its actual quality.
What is Anomaly Detection?
Anomaly detection – also known as outlier analysis – is an approach to data quality control that identifies those data points that lie outside the norms for that dataset. The thinking is that unexpected data outliers are more likely to be wrong than accurate. Truly unusual values are likely to be anomalies because something is wrong with them.
By identifying and isolating data anomalies, the remaining data – those values that conform to the expected norms – are allowed to populate the dataset. The separated, anomalous data can then be analyzed using the standard data quality metrics: accuracy, completeness, consistency, timeliness, uniqueness, and validity. If the data is determined to fail in any of these measurements, it can be deleted from the dataset or cleansed to retain its inherent value.
The key to successful anomaly detection is to first establish the normal pattern of values for a set of data and then identify data points that significantly deviate from these expected values. It’s important to not just identify the expected data values but also to specify how much deviation from these norms is considered anomalous.
By recognizing data anomalies, companies can focus on datasets that are more consistent and aligned with quality standards. Anomaly detection algorithms use advanced technologies like machine learning and AI to automatically detect irregularities, saving time and improving data quality.
What are 3 basic Types of Anomaly Detection?
Understanding the types of anomaly detection is crucial for making sense of unusual data patterns. Anomalies in business data generally fall into three primary categories:
- Point Anomalies: Also known as global outliers, these are singular data points that stand out sharply from the rest of the dataset. They are easy to identify because they deviate significantly from expected patterns. For example, a sudden spike in website traffic for a day could be considered a point anomaly.
- Contextual Anomalies: Also referred to as conditional outliers, these depend on the context of the data. An observation is considered an anomaly if it significantly deviates from normal behavior when looking at its specific context. An example could be a surge in ice cream sales during winter in a typically cold region. Here, the anomaly is considered in terms of the season and location.
- Collective Anomalies: These occur when a collection of data points deviates from the norm, but individual points may appear normal. These are often observed in time-series data where a pattern of anomalies unfolds over time, like a gradual increase in server errors.
Each type of anomaly requires different detection strategies to adequately respond to and manage them, ensuring businesses can glean accurate insights from their data.
Why is Anomaly Detection Important?
Anomaly detection is important in all industries. Whether it be in the manufacturing, financial, or sales sector, identifying potentially bad data results in a cleaner and more reliable core dataset. Eliminating anomalous data improves the overall quality and value of the data you use daily and reduces the risks of working with poor-quality or inaccurate data.
For example, in the manufacturing industry, anomaly detection is a way to improve quality control, by identifying production samples that fall outside quality standards. Anomaly detection can also help predict when individual machines require maintenance. McKinsey & Company estimates that using anomaly detection and other data-driven techniques can reduce machine downtime by up to 50% and increase machine life by up to 40%.
What is Data Anomaly Detection?
Data anomaly detection is the process of identifying data points that deviate significantly from expected patterns or trends within a dataset. These anomalies, or outliers, often signal errors, unexpected events, or potential opportunities. By identifying and analyzing these anomalies, organizations can uncover crucial insights and address issues proactively.
For example, if a company observes an uncharacteristic drop in web traffic during a holiday sale period, it might indicate a technical glitch or misaligned marketing efforts. Conversely, unexpected spikes in traffic could signal a successful campaign or unforeseen demand.
AI/ML-Driven Anomaly Detection: A Smarter Approach
Traditional data quality rules rely heavily on predefined parameters, making them rigid and time-consuming to scale. AI/ML-driven anomaly detection overcomes these limitations by automatically learning patterns from historical data and flagging deviations in real time.
How it Works:
- Baseline Creation: AI models establish expected data ranges based on past trends.
- Monitoring: Real-time data is continuously assessed against this baseline.
- Alert Mechanism: Deviations trigger alerts, empowering teams to act swiftly.
- Learning Loop: User feedback on alerts (e.g., marking as valid or invalid) refines the model’s future predictions.
For instance, a retail business using AI/ML-driven detection might avoid inventory shortages by identifying unusual spikes in product demand well in advance.
Impact of Data Anomalies on Businesses
Data anomalies can significantly disrupt operations if left unchecked. Here’s how they can affect organizations:
- Inaccurate Insights: Poor data quality undermines trust in analytics, leading to misguided business strategies.
- Revenue Loss: Anomalies may lead to financial errors, such as missed billing opportunities or operational inefficiencies.
- Compliance Risks: In regulated industries, undetected anomalies can result in penalties for non-compliance.
- AI/ML Performance: Machine learning models trained on flawed data deliver suboptimal results, reducing their utility in critical applications.
Addressing anomalies proactively safeguards businesses from these challenges and ensures their data-driven strategies remain reliable.
Prevent Data Anomalies Before They Disrupt Your Business
How Does Anomaly Detection for Data Quality Work?
Anomaly detection for data quality involves the continuous monitoring of data streams to identify outliers that may negatively impact the accuracy, completeness, and reliability of the data. Poor-quality data often contains unexpected or abnormal values, which can compromise analysis and decision-making.
Anomaly detection for data quality employs machine learning and artificial intelligence (AI) and statistical methods to isolate potentially faulty data points in real-time, allowing organizations to maintain clean and trustworthy datasets.
Here’s how it works:
- Establishes patterns of high-quality data through analysis.
- Identifies data points that deviate from these patterns.
- Flags or automatically isolates suspicious data for further review or correction.
By integrating anomaly detection into the data pipeline, companies can ensure ongoing data quality and minimize the risk of working with flawed datasets.
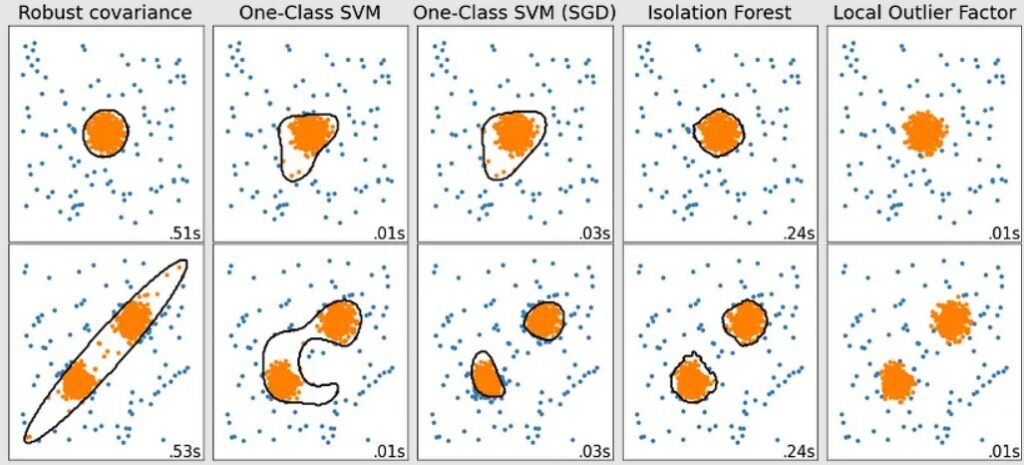
Popular Anomaly Detection Algorithms
- Robust Covariance: Identifies data points far removed from normal statistical deviations.
- One-Class SVM: Uses support vector machine technology to separate outliers from normal data points.
- Isolation Forest: Divides data using decision trees to isolate anomalies.
- Local Outlier Factor: Examines the density of data points to determine which ones are outliers.
The algorithm used often depends on the type of data being analyzed – and can produce significantly different results.
Which Method is Best for Performing Anomaly Detection?
When it comes to identifying anomalies in data, automated anomaly detection stands out as the superior method. This approach leverages advanced algorithms to monitor vast datasets, offering a level of efficiency and precision that manual methods simply can’t match. Here’s why automated systems are the best choice:
- Scalability: Unlike manual detection, which requires a substantial team of data analysts, automated systems can effortlessly handle an unlimited number of metrics. This means they’re ideal for companies dealing with large-scale data.
- Real-Time Insights: Automated anomaly detection provides immediate feedback, allowing organizations to address issues as soon as they arise. This capability ensures that businesses can maintain smooth operations without interruption.
- Accuracy and Consistency: Machine-driven detection reduces the risk of human error, offering a consistent and reliable analysis. Algorithms are able to identify patterns and irregularities with remarkable accuracy, making them invaluable for decision-making.
- Efficiency: By eliminating the need for extensive manual oversight, automated systems free up human resources, allowing teams to focus on more strategic tasks.
In conclusion, for those looking to perform anomaly detection, automated methods offer an unparalleled advantage in terms of speed, accuracy, and resource management. They’re the go-to solution for modern data-driven environments.
The Future of Anomaly Detection
The anomaly detection market is growing rapidly. According to the Global Anomaly Detection Industry report, the global market for anomaly detection solutions is expected to reach $8.6 billion by 2026, with a compound annual growth rate of 15.8%.
Going forward, anomaly detection will likely become more dependent on ML and AI technologies. These advanced technologies can analyze large quantities of data quickly, making them ideal for real-time monitoring of streaming data. They’re also useful for analyzing data from multiple heterogeneous sources – a task that can be challenging to perform manually. Additionally, ML/AI is more easily scalable than traditional data monitoring methods, which is important for handling the increasing growth of data facing most organizations.
Another ongoing trend in anomaly detection is the use of predictability. This involves using ML and AI technology to predict where outliers are likely to occur, allowing systems to quickly and efficiently identify anomalous data – including malicious code – before it affects data quality.
Transform Your Data Management with AI-Powered Anomaly Detection
Why First Eigen’s DataBuck Is Your Ideal Anomaly Detection Solution
First Eigen’s DataBuck leverages the power of machine learning and artificial intelligence technologies to enhance data quality validation. These and other advanced technologies and algorithms identify and isolate suspicious data, automating over 70% of the data monitoring process. The result? Vastly improved data quality with minimal manual intervention.
Contact FirstEigen today to learn how DataBuck can help you improve your data quality through automated anomaly detection.
Check out these articles on Data Trustability, Observability & Data Quality Management-
FAQs
Anomaly detection is the process of identifying data points that deviate significantly from the majority of data in a dataset. These outliers, known as anomalies, often indicate errors or irregularities in the data, which can affect overall data quality. By identifying and addressing these anomalies, businesses can improve the accuracy and reliability of their datasets.
Discover How Fortune 500 Companies Use DataBuck to Cut Data Validation Costs by 50%
![]()
Enter your email address to access to downloads
Recent Posts

The Power of Data Quality for AI Success
AI agents are only as reliable as the data they act on. As enterprises race to deploy AI, data quality has quietly become the deciding factor between success and costly failure. The Problem Nobody Is Solving Most AI conversations…
Mainframe Data Reconciliation for Cloud Migration
Cloud migration is no longer just an infrastructure decision. For data leaders and data engineers, it is a trust decision. …

What Do Failed AI Projects Have in Common?
Most AI failures are not model failures — they are data, governance, operational trust, and weak AI-ready foundations. “AI alone is not the solution – trusted, validated, continuously governed data is the…
Bad Data Is Costing You More Than You Think