
Seth Rao
CEO at FirstEigen
Start With Complex Data Analysis to Simplify Managing Complex Data Sets
Complex data analysis is necessary to help businesses and other organizations make sense of and use all the information they gather. To best utilize data analysis in your organization, it’s important to understand its value and know how it works. Do you know the process behind data analysis, or which data analysis tools are best for specific tasks? Learning more about complex data processing and analysis will help you get the most use out of your organization’s valuable data.
Quick Takeaways
- Complex data analysis uses AI and ML to extract actionable insights from collected data
- The data analysis process consists of five steps: definition, collection, cleaning, analyzing, and sharing
- Some of the most useful data analysis tools include H2O, KNIME, Microsoft Excel, Microsoft Power BI, Orange, Qlikview, R, RapidMiner, SAP BusinessObjects, Sisense, Tableau, Talend, TIBCO Spotfire, Thoughspot, and Trifacta
What is Complex Data Analysis—and Why is It Important?
How much are 79 zettabytes? It’s 20 million times more than all the letters the U.S. Postal Service delivers in a year. It’s a million times more than all the books in the Library of Congress. It’s 20 thousand times more than all the data stored on the entire internet. It’s almost twice as much as all the words spoken since the beginning of human history.
Seventy-nine zettabytes is also the amount of data generated worldwide in 2021. Mining all this data for useful information is a huge challenge and what data analysis is all about.
Data analysis involves extracting useful information and insights from collected data. It’s all about gathering, inspecting, cleaning, and transforming data so that you can turn raw data into useful information.
Complex data analysis goes further by using artificial intelligence (AI), machine learning (ML), and sophisticated algorithms to analyze collected data. Frequently this data comes from multiple sources and exists in multiple formats, which makes it difficult to manage manually. Automated solutions analyze all this data to find the connecting strings that tie it all together. Making sense of disparate data is necessary to provide actionable insight from what was previously just a collection of facts and figures.
Businesses use data analysis to help them make better decisions. Both short-term and long-term decisions are better when the insights provided by complex data analysis tools inform them.
Benefits of Complex Data Analysis:
- Better Decision-Making: Provides accurate insights for strategy development.
- Operational Efficiency: Automates data integration, reducing manual effort.
- Customer Experience Improvement: Ensures timely, personalized services by analyzing complex data sets.
- Regulatory Compliance: Ensures clean, auditable data to meet compliance standards.
Achieve 70% Automation in Data Monitoring with 90% Accuracy– Optimize Your Data Ecosystem Today
The 5-Step Data Analysis Process
Complex data analysis is a step-by-step process. You can’t just dive into a pile of raw, disconnected data and expect to make sense out of it. Instead, data analysts follow a set of procedures to provide the insights buried deep within the mass quantities of data available today.
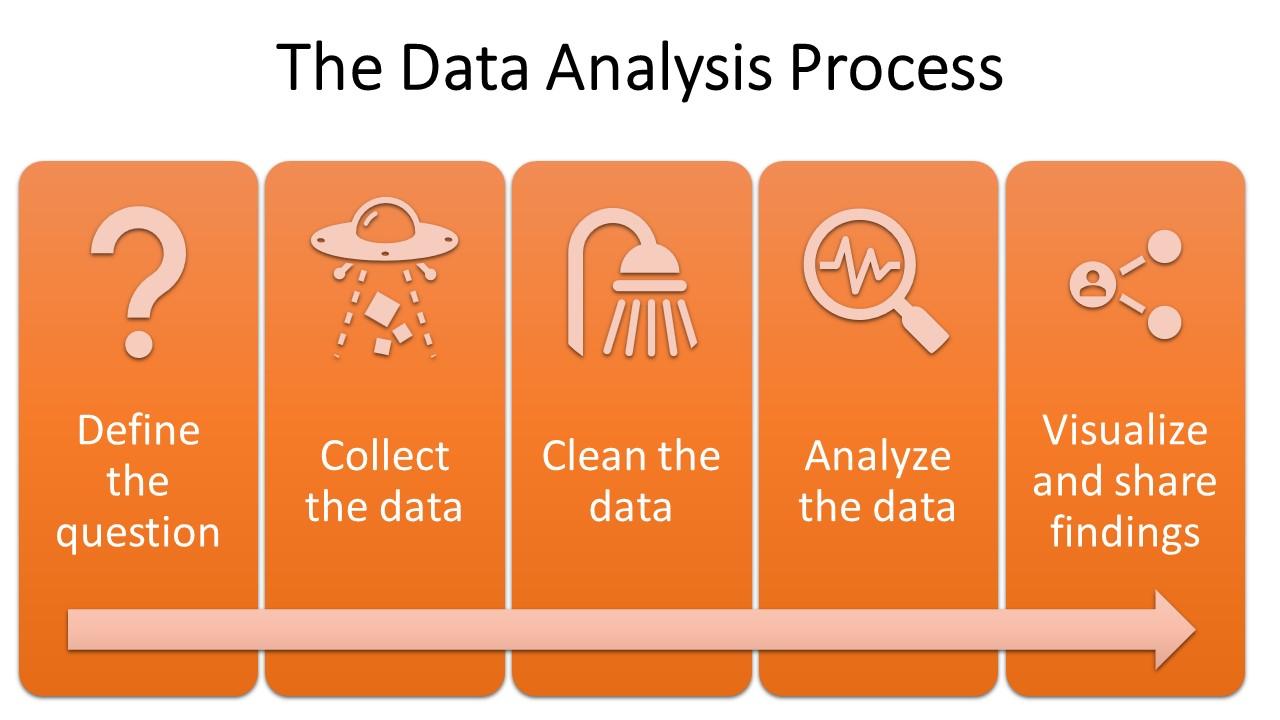
Data analysis typically consists of five primary steps:
- Define the question to answer
- Collect all available data from a variety of sources
- Clean the data so that it’s accurate, up-to-date, and standardized
- Analyze the cleaned and standardized data
- Visualize and share the findings of the analysis
We’ll look at each of these steps in more detail.
1. Define the Question
The data analysis starts with defining what you want to accomplish with the available data. For many organizations, that means identifying a business problem that needs solving or outlining a strategy to implement.
Ask yourself what you need to answer the question you’ve posed. That helps you identify what data to collect and how to organize and analyze that data.
2. Collect the Data
When you know what you want to accomplish, you can develop a strategy for identifying and collecting the data you need. That data can come from several sources, including:
- Customer databases
- Sales records
- Social media reviews
- Industry research
- Measured performance
- Customer feedback
Your goal is to find the best sources for the data you need. Some of this data, such as sales numbers, might be highly structured. Other data, such as social media mentions, might be completely unstructured. While structured data is easier to work with, MIT estimates that 80%-90% of the data today is unstructured. Turning all that unstructured data into a usable structure is part of the collection and cleaning process.
3. Clean the Data
Once you’ve identified and collected your data, you must ensure it’s usable. That means somehow structuring all the unstructured data, as well as ensuring that the data you’ve collected is:
- Accurate
- Complete
- Unique (no duplicates)
- Up-to-date
- Valid with a standardized data structure
Turning questionable and often unstructured raw data into accurate and reliable structured data requires data cleaning. You can accomplish this with a data quality monitoring solution like FirstEigen’s DataBuck. Ideally, you want a solution that automates the data cleaning process and is capable of handling huge amounts of data in a short period.
4. Analyze the Data
When you have clean data to work with, you can begin analyzing that data. Data analysts use a variety of approaches to gain value from collected data, including:
- Descriptive analysis identifies what has happened.
- Diagnostic analysis tries to understand why things happened.
- Predictive analysis seeks to predict, based on historical data, what might happen in the future.
- Prescriptive analysis enables you to make informed recommendations about future actions.
5. Visualize and Share the Findings
The final step in the data analysis is sharing what you’ve learned. You can often do this by using data visualization techniques that help people better understand complex datasets. Others can then use the insights gained to make better decisions in the future.
What Are the Best Tools for Complex Data Analysis?
Given the different types of analysis that might be necessary to gain the most insights from a set of data, experts use a variety of tools for data analysis. None of these tools work in the same fashion or create the same results. You may need multiple tools to gain the most value from your organization’s data.
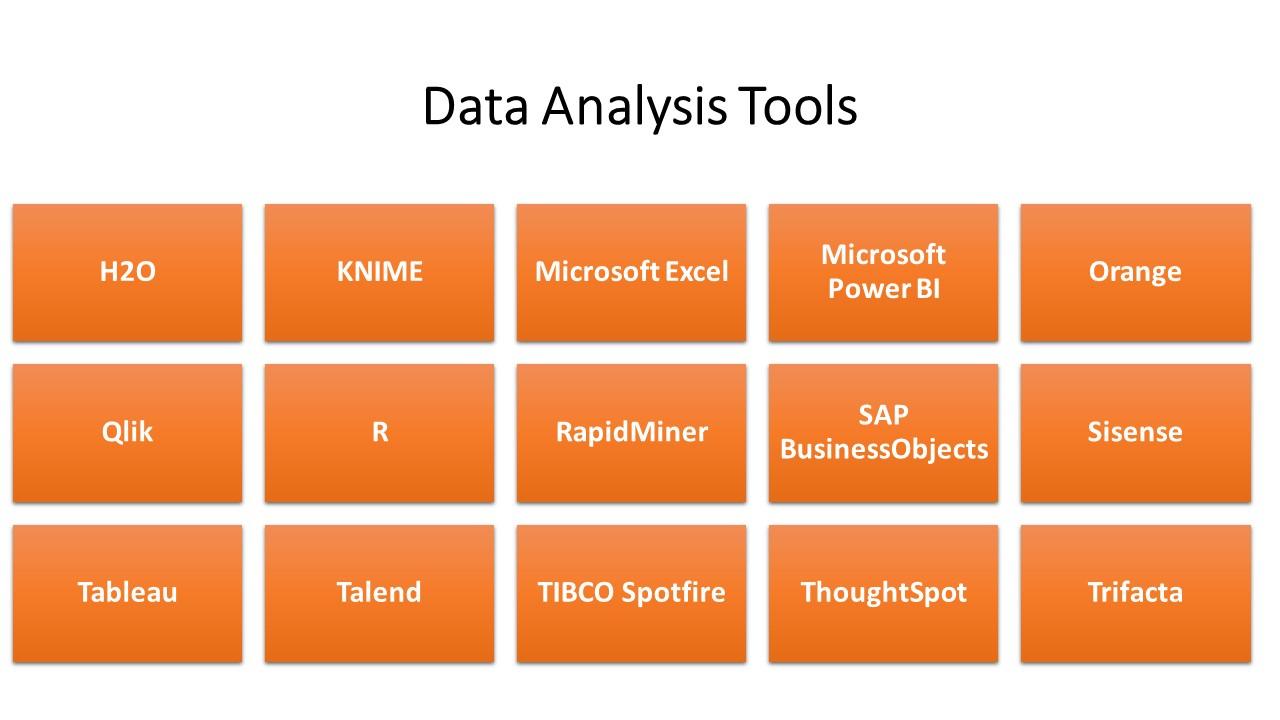
Here are fifteen of the most useful and most powerful data analysis tools in use today:
- H2O, an AI-based platform that excels at identifying patterns in collected data
- KNIME, which data analysts use to build machine learning solutions and visualize data
- Microsoft Excel, which lets non-analysts perform basic analysis on numerical data—and display their results in easy-to-understand charts
- Microsoft Power BI, a popular business intelligence platform with powerful data visualization capabilities
- Orange, a toolkit for data mining, machine learning, and data visualizations
- Qlik, a powerful yet easy-to-use tool for data visualization
- R Project, a free, open-source project that focuses on statistical computing and graphics
- RapidMiner, an enterprise-level data science platform for machine learning, deep learning, and other advanced data analysis
- SAP BusinessObjects, a suite of business analysis applications for data discovery, analysis, and reporting
- Sisense, a data analytics platform designed for both business analysts and technical developers
- Tableau, a free interactive data visualization tool
- Talend, an open-source cloud-based data analysis tool
- TIBCO Spotfire, a natural-language data analytics platform with natural language search powered by AI technology
- ThoughtSpot, a data analytics platform with advanced reporting and natural language searching
- Trifacta, an open source tool for transforming raw data into structured formats
Any of these tools could be useful for analyzing the data feeding into your organization. Just make sure you start with the data you need and thoroughly clean it to make it more effective.
How to Automate Analysis for Complex Data Sets?
Manual cleaning of complex data is time-consuming and prone to errors. Automation is the key to simplifying this process.
Steps to Automate Data Cleaning:
- Integrate tools like DataBuck to handle large data volumes with minimal manual effort.
- Implement AI/ML-based solutions to identify anomalies and standardize unstructured data.
- Use cloud-based platforms to ensure scalability and real-time updates.
Automation ensures faster, error-free cleaning, which improves the overall quality of your analysis for complex data sets.
Detect Data Issues Before They Impact Business Decisions
Improve Your Data Analysis With Clean Data from DataBuck
Inaccurate and unreliable data can make any data analysis difficult and suspect. When you want to ensure your data analysts are working with the highest quality data, turn to the data quality experts at FirstEigen. Our DataBuck software is an autonomous data quality management solution that automates more than 70% of the data monitoring process. Use DataBuck to ensure your data analysis derives from the best possible data quality.
Contact FirstEigen today to learn more about how data quality affects data analysis.
Check out these articles on Data Trustability, Observability & Data Quality Management-
FAQ
Industries such as healthcare, finance, e-commerce, and telecommunications often require complex data analysis due to the vast amount of data generated daily and the need for precise, data-driven insights.
Discover How Fortune 500 Companies Use DataBuck to Cut Data Validation Costs by 50%
![]()
Enter your email address to access to downloads
Recent Posts
What Do Failed AI Projects Have in Common?
Most AI failures are not model failures — they are data, governance, operational trust, and weak AI-ready foundations. “AI alone is not the solution – trusted, validated, continuously governed data is the…

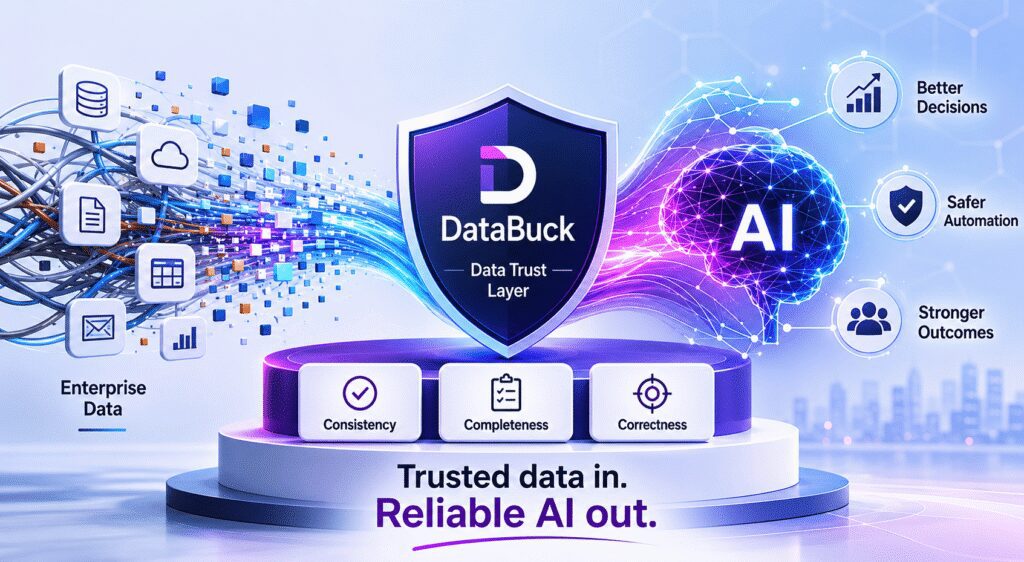
Why Data Trust Is the Real Foundation of AI Success
Enterprises are racing to adopt AI—LLMs, copilots, and autonomous agents that can trigger actions across systems. But as AI moves…
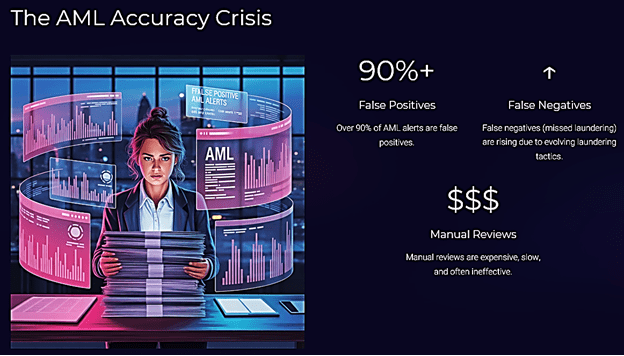
AI-Powered Data Quality Validation for Smarter AML Detection
Fraud, Anti-Money Laundering (AML) and counter-terrorist financing (CTF) programs are only as good as the data they consume. Advanced monitoring…
Bad Data Is Costing You More Than You Think