
Seth Rao
CEO at FirstEigen
What Are the 6 Key Data Quality Metrics and How to Automate Them on Azure and Snowflake for Data Trustability
Measuring the right Data Quality metrics ensures that you have the most trustable data. The more accurate is your data on Azure, Snowflake and other clouds, the more efficiently you can run your business. High-quality data reduces wasted time and effort, it also helps you make more informed decisions about your business operations. Next is being able to measure it automatically and without human intervention. DataBuck automates the process and gives you the most trusted data at the lowest cost.
To measure Data Quality and Data Trustability in your organization, there are six key metrics you should autonomously monitor regularly.
Quick Takeaways
- High-quality data is essential for the efficient and reliable operation of every business.
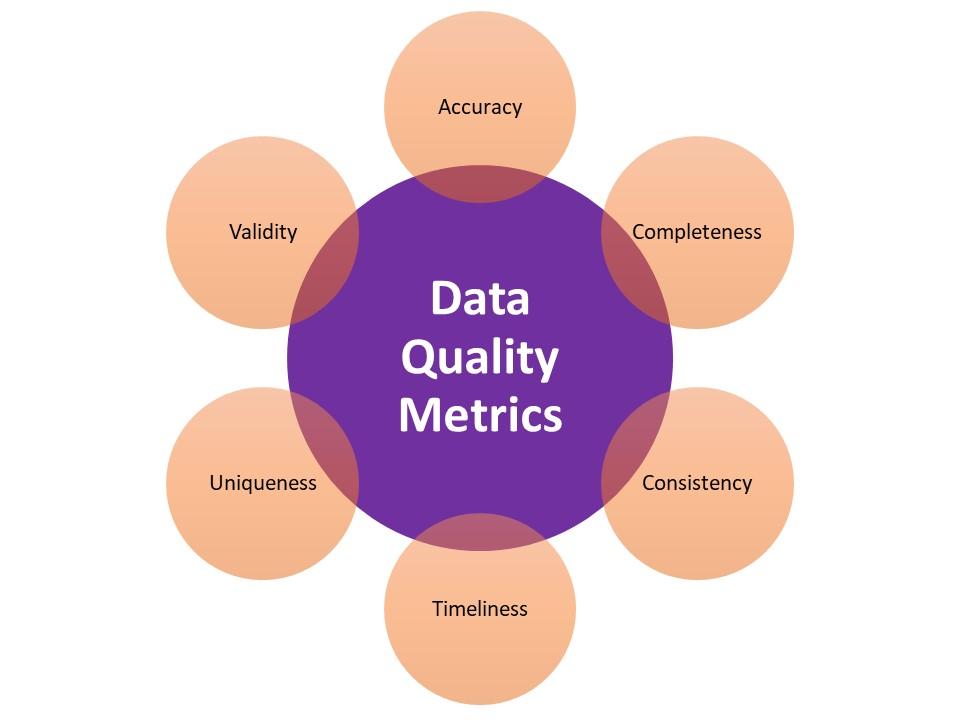
- The six key data quality metrics to autonomously monitor includes accuracy, completeness, consistency, timeliness, uniqueness, and validity.
- Poor-quality data can result in wasted resources, increased costs, unreliable analytics and bad business decisions.
What Are Data Quality Metrics and Why Are They Important?
Data quality metrics are standardized measures that assess the accuracy, consistency, and reliability of data within an organization. These metrics are crucial because they provide insight into the health of data, helping teams to identify and fix issues that may affect business operations. By monitoring data quality metrics, companies can ensure that their data is trustworthy and fit for purpose, leading to better decision-making and operational efficiency.
Regularly tracking these metrics helps businesses to avoid errors, reduce risks, and maintain compliance with industry standards. This is particularly important as poor data quality can lead to costly mistakes and inefficiencies. In summary, data quality metrics are essential for maintaining high standards of data integrity and supporting the overall success of a business.
Data Quality Metrics Examples
Data quality metrics examples include key indicators that help assess the reliability and accuracy of data within a system. Common examples include:
- Data Accuracy: Ensures that data reflects the real-world values it represents.
- Data Completeness: Measures the extent to which all required data is available.
- Data Consistency: Evaluates whether data is uniform across different databases and systems.
- Data Timeliness: Ensures that data is up-to-date and available when needed.
- Data Validity: Checks that data conforms to the required formats and standards.
These examples provide a holistic view of the data’s health and help organizations maintain high standards of data quality.
How Poor Data Quality on Azure and Snowflake Affects Businesses?
Low-quality data permeates many companies today. Gartner estimates that 20% of all data is bad, and that bad data can have a significant negative impact on company operations.
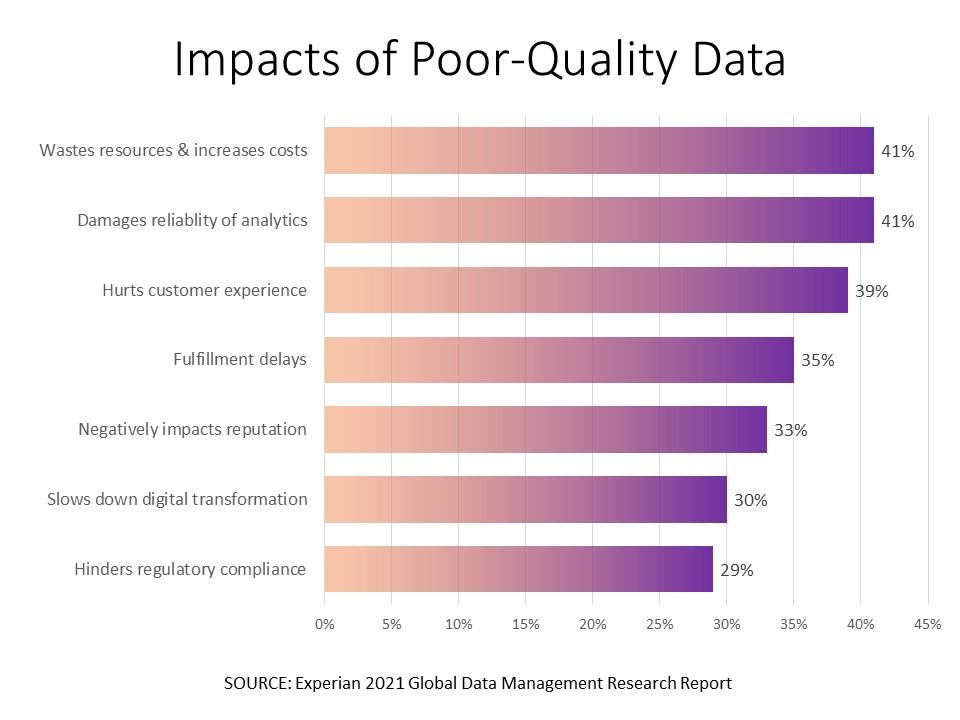
SOURCE: Created by author with data from the 2021 Experian Research
Having poor-quality data can make it difficult to operate your business daily. For example, sending an email promotion to a database full of outdated or inaccurate customer records will result in an unacceptable number of bounced messages. It also makes it difficult to conduct long-term planning, as your decisions can be based on bad data.
An Experian study revealed that 55% of business leaders lack trust in their business assets. These executives say that poor-quality data:
- Wastes resources
- Costs them money
- Damages the quality of their analytics
- Negatively impacts the customer experience
- Results in fulfillment delays
- Slows down their digital transformation
- Hinders compliance with government and industry regulations
If you want to avoid these issues, you need to improve the quality of your data – which you do by tracking data quality metrics as part of a complete data quality management program.
Discover How DataBuck Reduces Data Errors by 90%
What Data Quality Metrics Should You Measure on Azure and Snowflake?
It’s important to monitor the quality of your data and take appropriate action if it doesn’t measure up. To do this, you need to track six key metrics.
High ratings on each of these key metrics indicate high-quality data. Low ratings indicate lower-quality data that may need to be cleaned or have individual records deleted.
1. Accuracy
Accuracy measures the number and types of errors in a data set. Tracking this metric answers the basic question: Is the behavior of the data within expected bounds?
Different types of inaccuracies may be present in a data set, including:
- Anomalous Value: Whether the value in a field is within acceptable limits
- Anomalous Micro-Volume: Whether the volume of records within a microsegment of data is within acceptable levels
- Anomalous String: Whether the value in a field matches options in a pre-determined list
- Anomalous Intercolumn Relationships: Whether multi-column relationships in a record are accurate
- Anomalous Distribution: Whether the distribution of data within every microsegment is accurate
To measure accuracy, data can be compared to a reference data set. For example, customer-entered addresses and ZIP codes can be compared to the USPS address registry. It can also be checked logically to see if it falls within accepted bounds and makes sense.
Accuracy is typically measured as the percentage of errors to the total number of records. A lower percentage indicates higher data quality.
2. Completeness
It’s important that all critical fields in a record be fully populated. For example, a customer record missing the ZIP code is incomplete.
The completeness metric measures the number of records with incomplete data. It is tracked by identifying records with empty fields and typically expressed as a percentage of the total number of records.
Note that it may be acceptable for some fields to be empty – for example, a field that asks for optional customer feedback. A null in this type of field should not be included in the completeness metric.
3. Consistency
Consistency measures how individual data points pulled from two or more sets of data synchronize with one another. If two data points are in conflict, it indicates that one of both of the records are inaccurate.
For example, you may combine customer data from two different sources. When merging the data for a given customer, you want all the fields to agree – the customer should have the same street address, ZIP code, and phone number. If the two sources have different phone numbers for the same customer, the data is inconsistent.
Inconsistency can have a number of causes, including:
- Data entered incorrectly in one or more sources
- Data entered differently in one or more sources (i.e., “Cir” vs. “Circle” in a street address)
- Data sourced at different times (indicating newer data may reflect changes from older data)
- Different structure/schema between the data sources not fully matching
(The following video shows how DataBuck from FirstEigen ensures consistency between different data sources.)
4. Timeliness
Timeliness, sometimes called currency, is a metric that measures the age of data in a database. More current data are likely to be more accurate and relevant, as information – especially customer information – can change over time. In addition, there is a significant risk of multiplying errors when older data is moved through the pipeline, as all intermediate data repositories get populated with results from the outdated data.
Timeliness is tracked via timestamps on the data sources. Establish a base difference between the current date and then either reverify, update, or archive older data.
5. Uniqueness
The uniqueness metric tracks duplicate data. You don’t want to count any data twice, as that can unduly weight any results. It’s important to identify duplicates and either merge them or delete the duplicates.
6. Validity
Validity measures how well data conforms to standards. That is, data entered into a given field should be of the proper type; if the wrong data format is entered, that data may be unusable.
It’s important to check that each piece of data conforms to the correct type and format of data required. For example, a two-digit alphabetic state code cannot have three letters or any numbers in it. Date fields must conform to an established format, such as date/month/year, not any other order. Invalid data should be identified and corrected.
Optimizing Snowflake Data Quality: Best Practices and Strategies
To maintain high Snowflake data quality, it’s essential to focus on a few key practices. Start by regularly auditing your data for accuracy and consistency using data quality metrics in Snowflake to evaluate critical aspects such as accuracy, completeness, and timeliness. Leverage Snowflake’s built-in features, such as data validation and error logging, to identify and fix any issues quickly.
Automate data quality checks with Snowflake’s integration capabilities to ensure continuous monitoring and use data quality metrics in Snowflake to track improvements over time. Additionally, standardize your data input processes to reduce errors at the source. Implementing these strategies, along with robust data quality metrics in Snowflake, helps keep your data reliable, ensuring that it supports accurate decision-making across your organization.
90% of business decisions rely on accurate data. Ensure yours is reliable
Automate Data Quality and Trustability Metrics With DataBuck
DataBuck Automatically Tracks Data Quality and Trustability Metrics in the Data Lake, Data Warehouse and Data Pipeline Without Human Input
When you want to track key Data Quality and Data Trustability metrics, turn to DataBuck from FirstEigen. DataBuck is an autonomous Data Quality and Data Trustability management platform that automates more than 80% of the data monitoring process. It can automatically validate thousands of data sets in just a few clicks and ensure that your organization is always working with the highest-quality and most trustable data.
Contact FirstEigen today to learn how DataBuck can improve your firm’s data quality.
Check out these articles on Data Trustability, Observability & Data Quality Management-
FAQs
The five key metrics often used to measure data quality include:
- Accuracy: Ensures data correctly represents the real-world object or event.
- Completeness: Verifies that all necessary data is present.
- Consistency: Ensures that data is the same across multiple systems or databases.
- Timeliness: Confirms that data is up-to-date and available when needed.
- Validity: Checks if data conforms to the required formats and standards.
These metrics are essential for maintaining high data quality, which is crucial for effective business operations and decision-making.
When balancing quality versus scale in data, data accuracy stands out as the most crucial metric. While scaling data can increase volume, it’s the accuracy that ensures the data remains reliable and useful. High accuracy means that the data correctly represents real-world scenarios, which is essential for making informed decisions. Without accuracy, the benefits of scaling become meaningless, as poor data quality can lead to flawed insights and costly mistakes. Therefore, maintaining data accuracy should be the top priority, even as data scales.
Data quality metrics are measurable indicators used to evaluate the health and reliability of data within a system. They include accuracy, completeness, consistency, timeliness, uniqueness, and validity.
Data quality can be measured by tracking key metrics such as accuracy, completeness, and consistency. Tools like Snowflake and DataBuck automate this process, ensuring continuous monitoring and actionable insights.
Examples include:
- Accuracy: Ensuring data reflects real-world values.
- Completeness: Checking that all required fields are filled.
- Consistency: Confirming data alignment across different systems.
- Timeliness: Measuring the freshness of data.
- Uniqueness: Removing duplicate records.
- Validity: Ensuring data conforms to required formats and standards.
Yes, tools like DataBuck automate data quality checks on Snowflake, validating metrics such as accuracy and completeness in real time. Snowflake’s native features and third-party integrations like Talend or Informatica also enable seamless automation for reliable data.
Snowflake offers built-in tools like data validation and error logging to monitor data quality metrics such as accuracy and consistency. Additionally, Snowflake's integration capabilities allow for automated checks and continuous monitoring.
The best tools for measuring data quality include DataBuck for automated validation, Informatica Data Quality for comprehensive profiling, and Talend Data Quality for standardization and cleansing. These tools ensure accuracy, consistency, and completeness, especially on platforms like Snowflake and Azure.
Discover How Fortune 500 Companies Use DataBuck to Cut Data Validation Costs by 50%
![]()
Enter your email address to access to downloads
Recent Posts


Get Started!