Turbo Charge Data Catalog with Data Trust Score
Get Trust Scores for 1000’s of tables registered in the Data Catalog w/o any manual effort
Scalable

Set up 1,000 data assets in less than 40 hours
Fast

Validate 100 million records in 60 seconds
Better

Look for 14 types
of data errors
Economical

Validate 10,000 Data Assets in less than $50
Secure

No Data leaves your Data Platform
Integrable

Data Pipeline Data Governance Alert System Ticketing System
Integrate Data Catalog with Data Trust Scores
Trust and Data Quality are critical to making the most efficient use of data and data governance platforms. It is vital to measure and communicate data quality to ensure that stakeholders are making decisions based on good information.
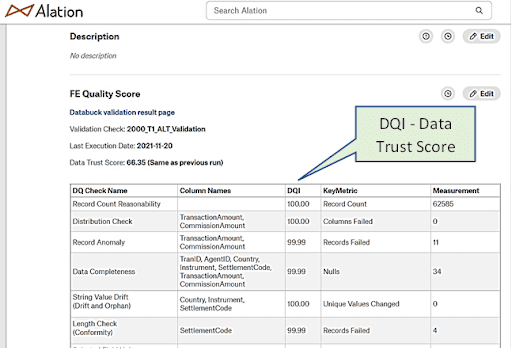
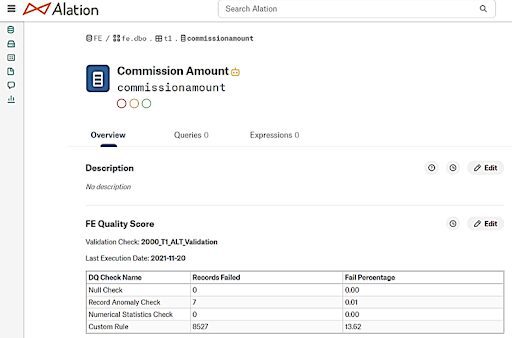
DataBuck enables Catalog users (Alation, Zeenea, Octopai, Informatica, IBM, Ataccama, and many others) to autonomously evaluate data quality, calculate a trust score for their data assets (“DQI”), and display the results in the data catalog.
Watch How DataBuck Turbo Charge Alation Data Catalog

Out-of-the-box AI/ML capabilities

Automated DQI Without Human Intervention

Simple to Integrate With Alation
Transition from a manual model to a trust-based data-driven approach With DataBuck

How does The Data Quality Platform work?
Scan: DataBuck scans each data asset registered in your Data Governance Platform.
Auto Discover Metrics- DataBuck autonomously creates data health metrics specific for each data asset. The well-accepted and standardized DQ tests are customized for each data set individually, leveraging AI/ML algorithms.
Monitor- Health metrics are then translated to a data trust score. Health metrics are computed based on quality dimensions for each column in the data asset.
Alert: DataBuck continuously monitors the health check metrics and trust score and alerts users when the trust score becomes unacceptable.
Autonomous Data Trust Score for Data Catalogs
Incorporating Data Trust Score into the Data Catalog Challenging? More insights in this White Paper
The deviation of the trust score displayed in the summary of analysis results shows how the quality score changed between the last two analyses. Every violation discovered can be double-clicked for further information:
- Expand the dimension to see which columns are affected at the data asset level. Click a column name to see the dimension details for that column.
- At the column level, click the dimension name for further details.
Users can then decide for each Data Quality violation to be ignored or evaluated during the analysis. Users can choose for the entire data asset or individual columns.

Introduction DQ Monitoring on AWS
FirstEigen recognized in AWS re:Invent as best-of-breed DQ tool
Autonomous Data Quality validation on Cloud
Friday Open House
Our development team will be available every Friday from 12:00 - 1:00 PM PT/3:00 - 4:00 PM ET. Drop by and say "Hi" to us! Click the button below for the Zoom Link: