

Sri Harsha Tanamala
sriharsha.tanamala
Teradata to BigQuery Migration: 230 Billion Records Reconciled
An enterprise data estate was modernized from Teradata to Google BigQuery. Record-level reconciliation replaced “it looks right” with evidence, and the cutover became faster and easier to trust.
| 40+ PB Total data volume across the estate | 9.2 trillion Rows across the 40 largest tables | 150–250 Columns per large table, each verified |
Moving a warehouse is easy. Proving that every number survived the move is the hard part, and it is the part that decides whether the new platform gets trusted.
The enterprise in this story runs more than 40 petabytes of data across many domains. Billing is one of them, alongside finance, customer, and operational data. The largest tables held around 230 billion records with 150 to 250 columns each, and mid-sized tables held about 50 million rows across roughly 70 columns. Every domain had to move from Teradata to BigQuery with its numbers intact.
Sampling and row counts could not carry that load. This case study covers how DataBuck became the independent data reconciliation layer across the migration, and what changed for the teams that depended on the data.
Why Large Migrations Stall
A warehouse migration rarely fails loudly. Pipelines run, jobs finish, and the new platform fills with data. The trouble shows up later: a finance close that does not tie out, a discount applied one cycle late, or a total a few cents off per account across millions of accounts.
When teams cannot see where the gap is, the migration slows. Engineers rerun loads, sample tables by hand, and debate whether a difference is real or a rounding artifact. Each round pushes cutover further out and keeps two platforms running in parallel longer than planned.
At 230 billion records, “it looks right” is not a test. Without evidence, every difference becomes a research project.
AN ILLUSTRATIVE EXAMPLE OF THE PATTERN
A row-count check passes on a large usage table. Weeks later, a finance analyst finds that one revenue category totals slightly less on the new platform. The investigation spans several teams, reruns part of the load, and takes days to isolate one column where decimal precision changed between engines. The count check had passed the whole time.
What a Silent Gap Costs
Small errors compound across an enterprise. A rounding difference on a discount table becomes a customer dispute. Missing adjustments become a question at quarter end. Each open question also pulls the same few senior engineers away from the migration, so the program slows at exactly the moment it needs momentum.
- Delayed cutover: the old platform stays live while doubts are resolved.
- Duplicate running cost: two warehouses are paid for until confidence is established.
- Late discovery: errors found after go-live cost more to fix than errors found during the load.
- Eroded trust: business teams question the new platform before it has had a chance to prove itself.
THE TURNING POINT
DataBuck Puts Evidence at Every Stage
DataBuck became the reconciliation layer that every load had to pass. It offers two matching modes, and the program used both, in sequence. Aggregate matching confirmed that totals agreed across business dimensions. Cell-to-cell matching confirmed that each record agreed, value by value.
Before any values were compared, DataBuck’s key discovery identified the fields that uniquely identify each record, so comparisons ran on the right basis. That mattered on legacy tables, where the original keys had been maintained informally for years.
Two Matching Modes, Used in Sequence
MODE 1
Aggregate Matching
Fast, business-level confidence across very large sources.
- Count-based: row counts compared per table and partition.
- Group-by on business keys: amounts and other measures summed by segment, region, and cycle, with differences shown.
- Distinct counts: identifiers compared within each group.
- Configurable segments: multiple flavors of the same check.
MODE 2
Cell to Cell Matching
High-speed, like-for-like comparison of the same record on both sides.
- Record to record: each source record matched to its target counterpart.
- Count parity: counts confirmed on both sides before deeper checks.
- Duplicates and orphans: flagged on each source.
- Mismatches by column: counts per column, with sample records.
Schema and datatype verification after full cutover
Once the migration was fully cutover, DataBuck verified that the structure of the new platform matched the intent of the old one. It checked column names, datatypes, and precision for each migrated table. A datatype or precision change that looks harmless on a dashboard can still change a billed amount, so this check ran as a final gate, not a formality.
| Check | What it answers | Where it mattered |
| Count parity | Do both sides hold the same number of records? | Every table, every load cycle |
| Group-by aggregates | Do totals agree by business dimension? | Revenue, usage, and volumes by region and cycle |
| Distinct key counts | Are identifiers complete on both sides? | Customer and account identifiers |
| Duplicates and orphans | Did the load add or drop records? | Discount and adjustment tables |
| Column mismatch counts | Which columns disagree, and how often? | Wide tables with 150 to 250 columns |
| Schema and datatypes | Do names, types, and precision match the target model? | Every table, after complete cutover |
Reconciling Numbers Most Teams Never Attempt
These figures describe the working scale of the program. The totals are simple products of rows and columns, shown so the size of the job is clear.
230B
records in the largest tables
Each with 150 to 250 columns40+ large tables
reconciled at billion-record scale across the migration
Including the 230B-record tables, spanning billing, finance, and operations50M
rows in mid-sized tables
Around 70 columns each3.5B
individual data values per mid-sized table
50 million rows × 70 columnsMaking the runs fit the batch window
Full cell-level comparison on tables this size cannot run every cycle inside a normal batch window. Two choices made it practical. After the first full comparison, incremental matching checked only the partitions and date ranges that had changed, so steady-state runs stayed short while full history stayed covered. Aggregate checks ran on every table, and cell-to-cell matching ran at full depth wherever the business impact was highest.
From Debate to Fixes: The Turnaround
With evidence in place, the program changed shape. Teams stopped debating whether a difference was real and started fixing the ones that were.
Before DataBuck
- Confidence rested on sampling and row counts.
- Differences surfaced when a business team questioned a total.
- Engineers rebuilt comparisons by hand for each table.
- Cutover kept moving as doubts piled up.
After DataBuck
- Every migrated table carried count, aggregate, record-level, and schema evidence.
- Mismatches arrived with column names and sample rows, so work started at the cause.
- Reports gave business and engineering teams the same view.
- Critical tables were reconciled daily after cutover.
WHAT ONE MISMATCH LOOKED LIKE ONCE THE TOOL WAS IN PLACE
A migration matching run flagged a discount amount column that differed on a small share of rows. The sample records pointed to a precision change between the two platforms. The fix went into the target load, the table was matched again, and the mismatch count dropped to zero. The whole cycle took an afternoon instead of a week.
The Same Pattern on Another Migration
The same reconciliation approach has been applied to another enterprise moving Teradata workloads to Databricks Delta Lake. The matching modes, key discovery, and incremental runs carried over directly, giving that team the same evidence trail before cutover.
Reading the transformation logic
The hardest part of a migration is often the logic, not the data. DataBuck reads ETL scripts and related documentation, works out how each target column is derived, and proposes the comparisons needed to test it. Engineers review the logic and the checks rather than writing every comparison by hand.
What Other Modernization Teams Can Take From This
Reconcile at the record level, not only the count level
Counts can match while values drift. Cell-to-cell matching finds the errors that reach customers and reports.
Confirm the keys before comparing the values
Informal legacy keys make every comparison suspect until they are discovered.
Verify schema and datatypes after full cutover, not just at go-live
Precision and type changes can alter amounts while every row count still looks correct.
Keep reconciling after cutover
Rules and feeds keep changing. Incremental runs keep the new platform honest.
A migration is finished only when its numbers can be proven. With evidence at every stage, the move to the new platform became smoother, faster, and easier to trust.
DataBuck Matching Superpower
-
Cross-Platform Reconciliation
Matches data across heterogeneous systems
-
Context Aware with AI
Matching metrics are recommended, leveraging AI
-
Full Coverage Reconciliation
Does not rely on sampling; uses advanced dimension reduction techniques
-
Compute Optimization
The majority of the compute is down at the data source (“push down”)

Discover How Fortune 500 Companies Use DataBuck to Cut Data Validation Costs by 50%

Enter your email address to access to downloads
Recent Posts
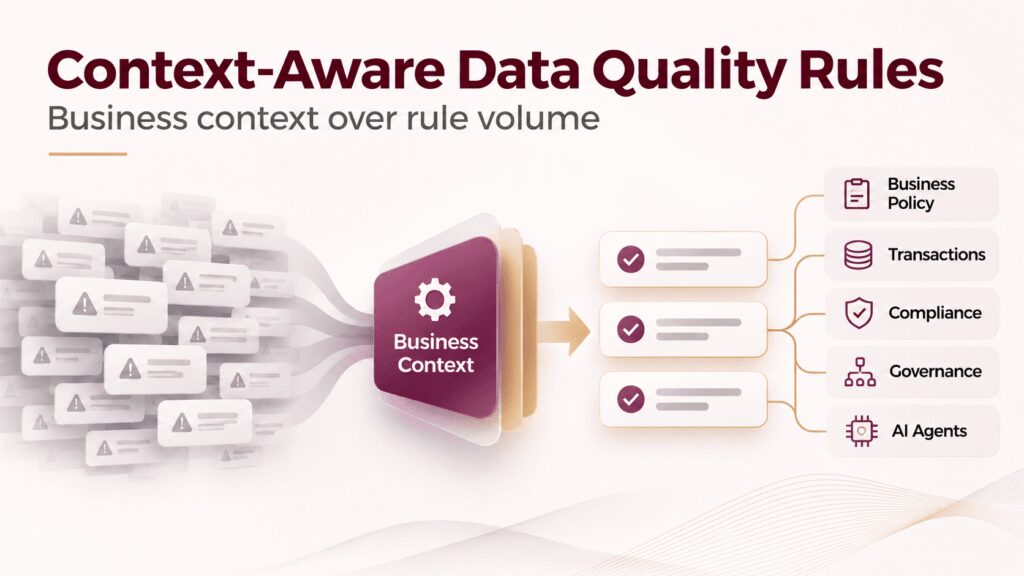
Context-Aware Data Quality Rules: Why Data Quality Needs Judgment, Not Just Volume
You can easily produce thousands of data quality rules using modern profiling tools but what makes them worth implementing? Your…
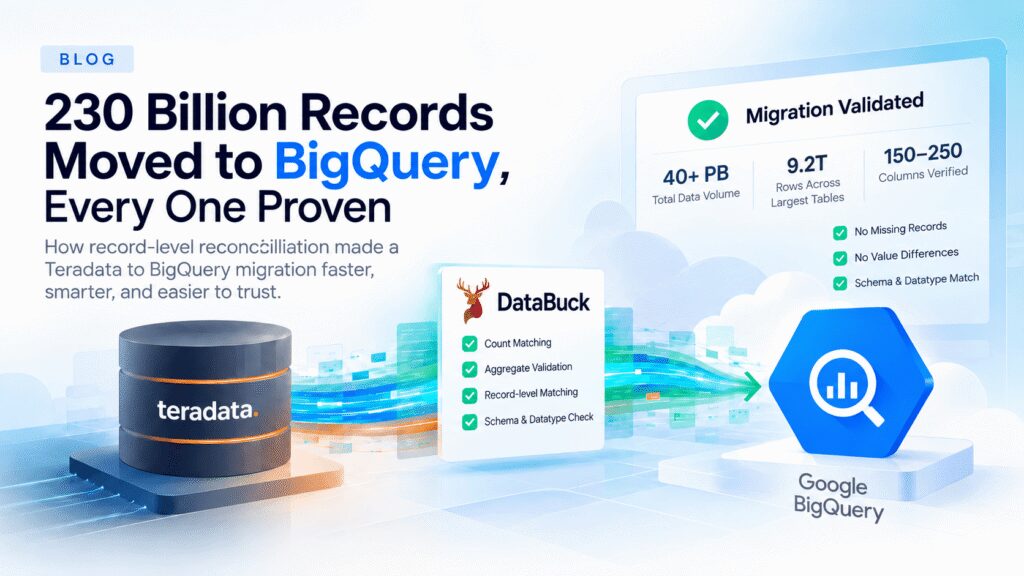
Teradata to BigQuery Migration: 230 Billion Records Reconciled
An enterprise data estate was modernized from Teradata to Google BigQuery. Record-level reconciliation replaced “it looks right” with evidence, and…
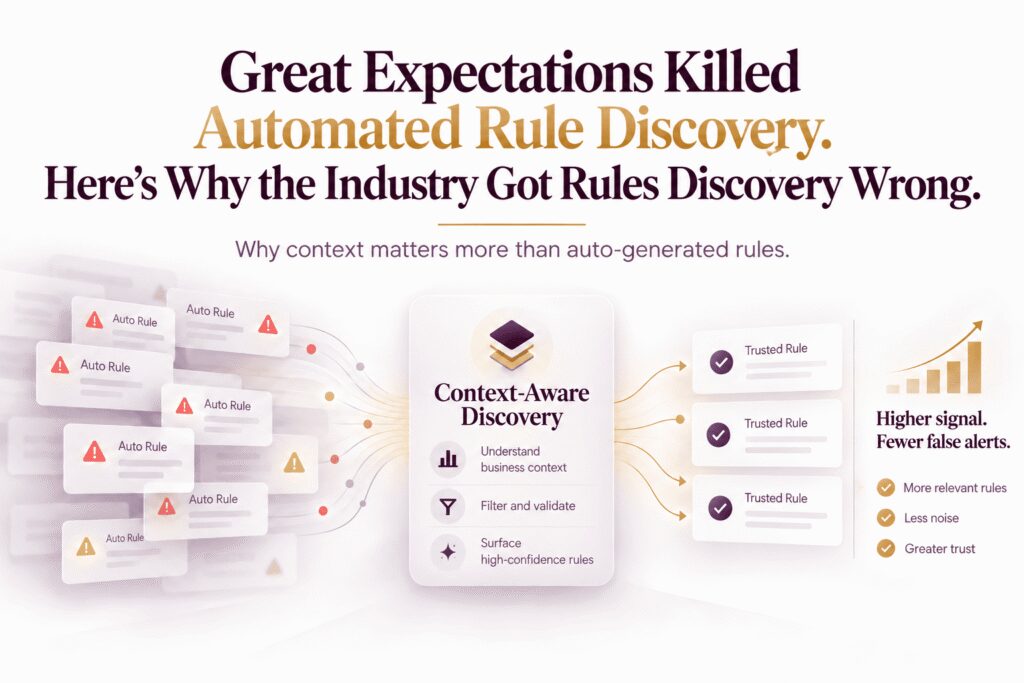
Why Data Quality Teams Need More Than Automated Rules
Great Expectations Killed Automated Rule Discovery. Here’s Why the Industry Got Rules Discovery Wrong. Auto-generating 100 rules in 60 seconds helped data…
Bad Data Is Costing You More Than You Think